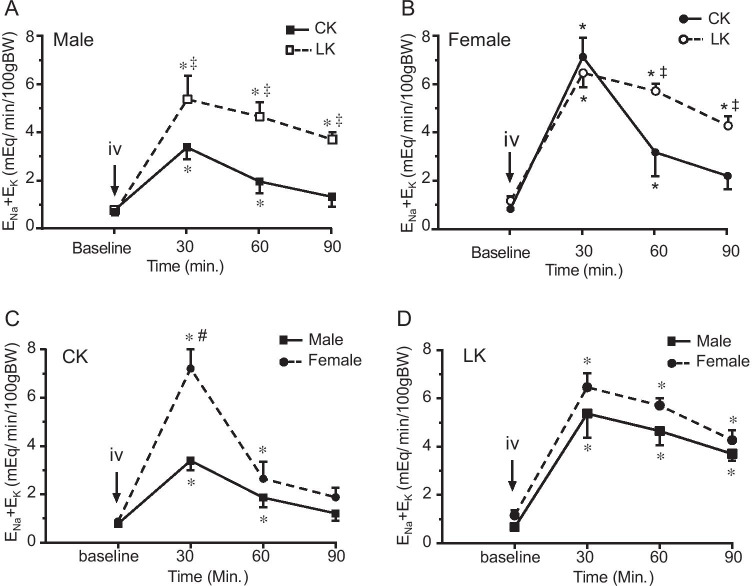
Fig. 4.
Effect of HCTZ on total cation excretion (ENa + EK) in male and female mice fed with CK and LK diet. ENa + EK was measured before and after HCTZ iv bolus injection (until 90’). The peak change was observed 30’ after HCTZ administration in all groups of the mice. 4A and 4B compare CK and LK in male (A) and female (B) mice. 4C and 4D compare male and female mice with CK (C) and LK (D) intake. Data are presented as means ± SE. *: Significant difference from the baseline (n = 6, P < 0.05, by one-way ANOVA test); ‡: Significant difference between CK and LK groups; #: Significant difference between males and females fed with same diet (n = 6, P < 0.05, by one-way ANOVA test)

