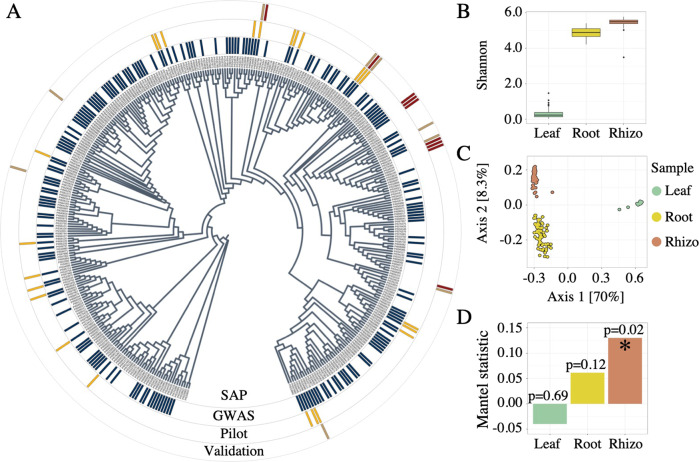
Fig. 1. Sample type and population selection.
A Phylogenetic tree representing the 378 member sorghum association panel (SAP, inner ring), the subset of 200 lines selected for GWAS (second ring from the center, in blue), the 24 lines used for sample type selection (Pilot, third ring from the center, in yellow), and the 18 genotypes used for GWAS validation containing either the Chromosome 4 minor allele (red) or major allele (brown) identified by GWAS (outer ring). B Shannon’s entropy values from 16S rRNA amplicon datasets for the leaf (green), root (yellow), and rhizosphere (red) sample types across all 24 genotypes used in the pilot experiment. C Principal coordinate analysis generated using Bray–Curtis distance for the 24 genotypes across leaf (green), root (yellow), and rhizosphere (red). D Mantel’s R statistic plotted for each sample type across all 24 genotypes indicating the degree of correlation between host genotypic distance and microbiome distance.

