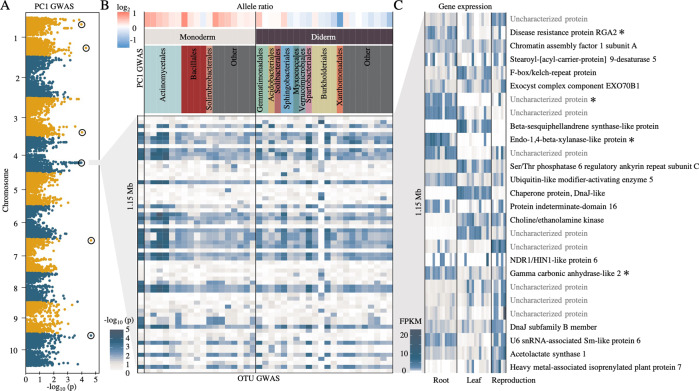
Fig. 4. A sorghum genetic locus is correlated with rhizosphere microbial abundance.
A Manhattan plot of PC1 community analysis GWAS. Top candidate SNPs above a threshold of –log10 (p = 10–4) are circled. B Individual OTU GWAS of all OTUs with at least 5 SNPs above a threshold of –log10 (p = 10–2.5) in the 1.15 Mb window identified on the same chromosome 4 locus identified by PC1 GWAS (lower heatmap). For each OTU, the log2 fold change in abundance between the sorghum major (red) or minor (blue) allele groups within this locus was determined (upper heat map). OTUs were grouped based on the predicted presence of one or two membranes (monoderm or diderm) within each bacterial order and colored as in Fig. 2. C Tissue-specific gene expression data for sorghum genes within the chromosome 4 locus. Darker blue indicates higher expression (normalized FPKM). Asterisks indicate genes whose expression is predicted to be root-specific.

