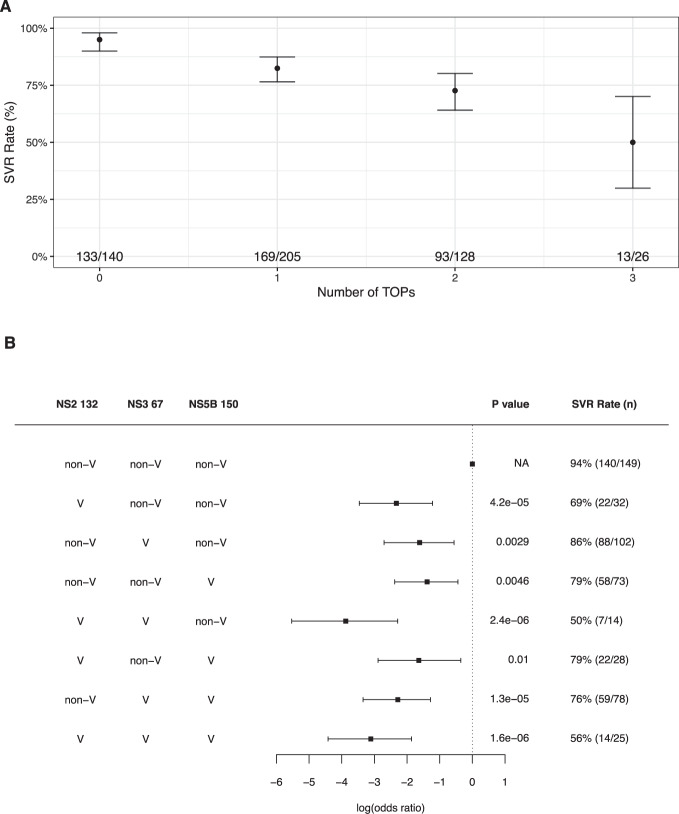
Fig. 2. Covariation of treatment outcome polymorphisms (TOPs) and their impact on sustained virological response (SVR) rate.
A SVR rate for patients with different numbers of TOPs in baseline sequences. The dots indicate the SVR rate in each group and the lines indicate its 95% confidence intervals. The numbers in each group are shown at the bottom of the figure. B Covariation between the three novel TOPs and their association with treatment outcome. Combinations tested are listed in the table on the left. The squares show the estimated effect size (log(odds ratio)) for each group and the lines show its 95% confidence interval estimated from logistic regression. The P-value (logistic regression) and the SVR rate for each group are shown on the right.

