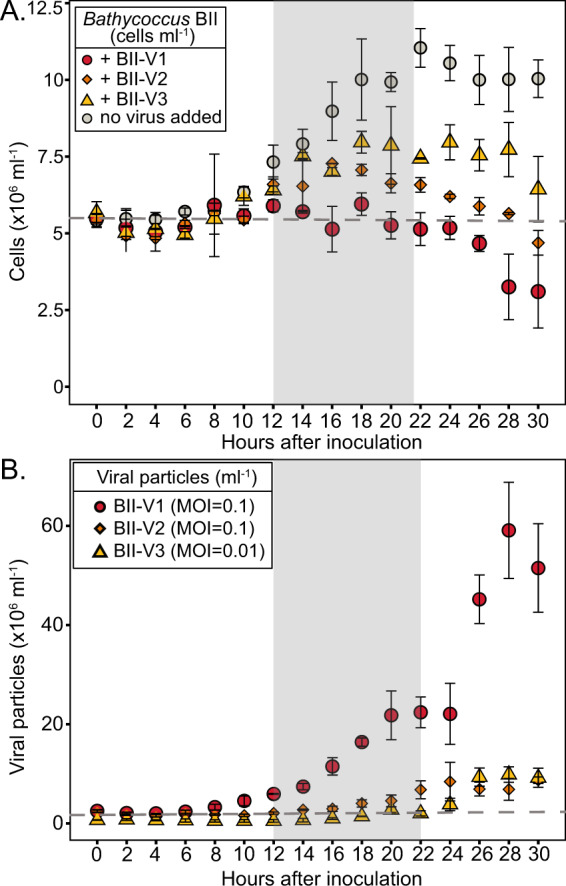
Fig. 3. Temporal studies reveal differential infection dynamics.

Flow cytometric enumeration of host cell abundance and viral particle abundance over experimental time courses. A Non-infected Bathycoccus Clade BII RCC716 control cultures (grey circles) as well as RCC716 cells in cultures inoculated with BII-V1 (red circles), BII-V2 (orange diamonds) and BII-V3 (yellow triangles). B symbols are as in A but represent the abundance of viral particles rather than hosts. Points and error bars represent mean values and standard deviation for biological triplicates. Horizontal grey dashed lines represent the cell or viral concentration at T0. Non-shaded and shaded areas represent light and dark periods, respectively. These experiments indicate BII-Vs are lytic viruses, although note that an intermediate state of chronic infection, without host lysis or integration into the host genome, has been described for O. tauri viruses [89].
