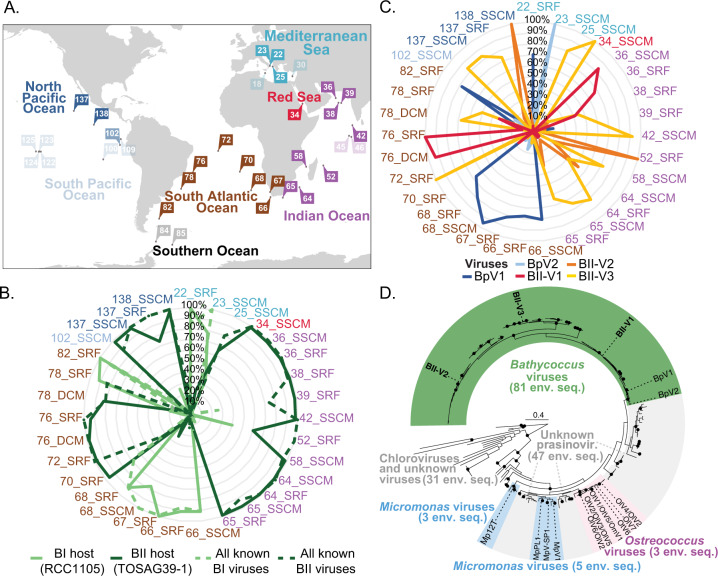
Fig. 4. Global distribution and diversity of Bathycoccus species and viruses.
A Map of Tara Oceans stations (modified from Sunagawa et al. [46]) from which metagenomic reads were recruited using the B. prasinos (BI), Bathycoccus RCC716 (BII), BII-V1, -V2 and -V3, as well as BpV1 and BpV2 genomes. Most stations contained reads from both the host and respective virus (solid colours) while in some only hosts reads were detected (muted colours). All stations in which any of the Bathycoccus viruses were detected also contained reads from the respective hosts. B Relative contribution of each Bathycoccus species (solid lines; BI, light green; BII dark green) based on [24] at Tara Oceans stations where we also detected viruses. Also shown are the relative contributions of viruses, computed as the sum of reads competitively recruited to genome-sequenced BpVs versus BII-Vs. C Relative contribution of reads competitively mapped against all Bathycoccus viruses. The colour code for stations is the same in all panels. SRF surface water, SSCM sub-surface chlorophyll maximum. D Phylogenetic reconstruction of prasinovirus PolB genes in GenBank nr and metagenomic data. ML reconstruction using the model LG + G + I based on a multiple sequence alignment of amino acids. Branches with BS values ≥90% (1000 replicates) are indicated (black dots). A total of 159 viral PolB sequences from Tara Oceans data were incorporated from assemblies with >300,000 contigs [46] along with 21 from viruses with known hosts and sequenced. Coloured blocks represent taxonomic classification of lineages based on supported clades (BS ≥ 90%) that include viruses with known hosts (only these are named on the tree). All labels and accessions are shown in Fig. S5.

