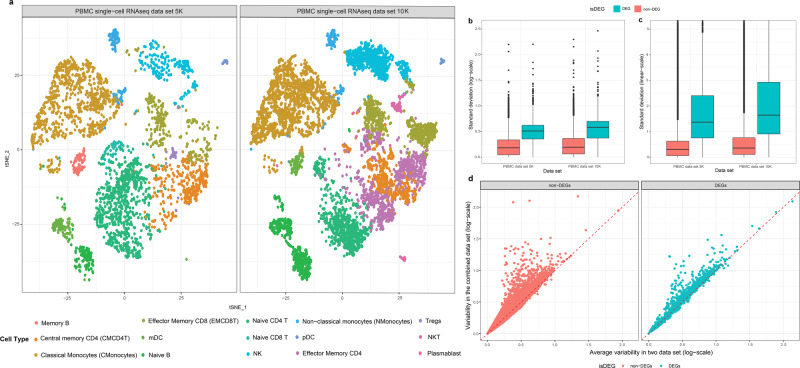
Fig. 1. Overview of single-cell CITE-seq data from two PBMC samples.
a t-SNE plots show the similarities in Pearson correlation coefficients among gene expression profiles of individual cells in two single-cell PBMC RNA-seq data, respectively, on the left and right. Cell type* is denoted by color. b, c Comparison of gene expression variability measured in standard deviation (y-axis) per gene and cell type pair in log-scale (b) and linear-scale (c) for both datasets (x-axis). The genes were split by differentially expressed genes (DEGs; n = 2876 gene and cell type pairs; red) and non-differentially expressed genes (non-DEGs; n = 145,305 gene and cell type pairs; blue). The standard boxplot notation was used (lower/upper hinges—first/third quartiles; whiskers extend from the hinges to the largest/lowest values no further than 1.5 * inter-quartile ranges). d. Comparison of within-sample (x-axis) and between-sample variability (y-axis) in gene expression levels per cell type, split by DEGs (n = 2876) and non-DEGs (n = 145,305) per cell type. Standard deviation is measured for each gene and cell type first separately in two PBMC single-cell datasets followed by taking the average (x-axis), then also in merged PBMC data set (y-axis). Only the nine cell types commonly detected in two data sets were used in the analysis. *(CMCD4T: central memory CD4+ T cell; CMonocytes: classical monocytes; EMCD4T: effector memory CD4+ T cell; mDC: myeloid dendritic cell; MemoryB: memory B cell; MemoryCD8T: memory CD8+ T cell; NaiveB: naive B cell; NaiveCD4T: naive CD4+ T cell; NaiveCD8T: naive CD8+ T cell; NKcells: natural killer cell; NKT: natural killer T cell; Nmonocyte: non-classical monocyte; pDC: plasmacytoid dendritic cell; TRegs: regulatory T cell).

