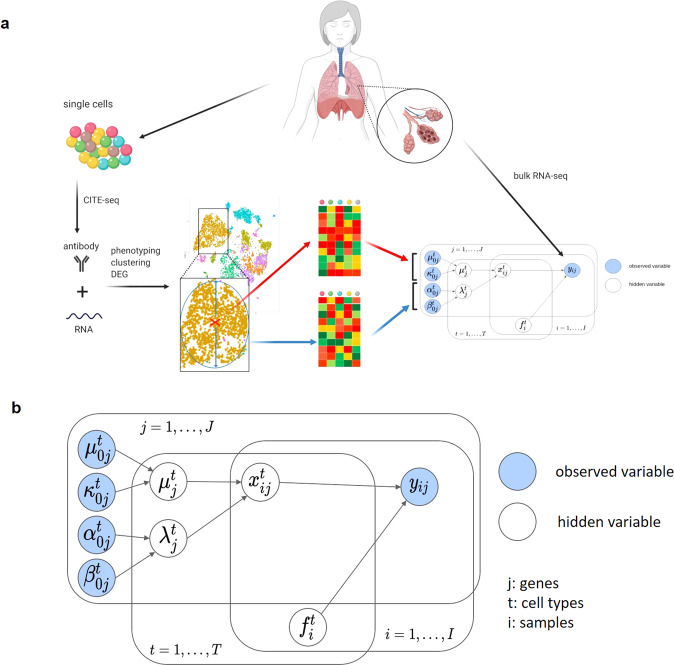
Fig. 3. BLADE workflow.
a To construct a prior knowledge for BLADE, we used CITE-seq data that contains gene expression and cell surface marker profiles of each cell. Cells are then subject to phenotyping, clustering, and differential gene expression analysis. Then, for each cell type, we retrieved average expression profiles (red cross and top heat map) and standard deviation per gene as the variability (blue circle and bottom heatmap). This prior knowledge is then used in the hierarchical Bayesian model (bottom right) to deconvolute bulk transcriptome profiles. b A graphical model of BLADE represents random variables, observed and hidden variables, respectively, in blue and gray nodes, and their dependency associations (arrows). See the text for the details of the model.

