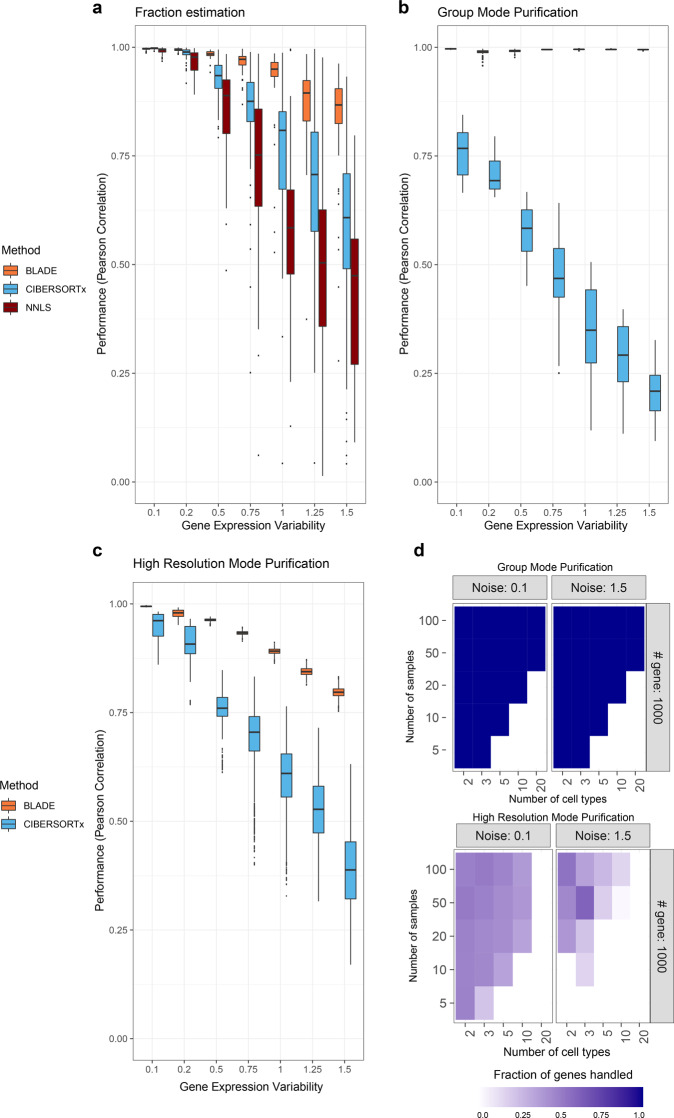
Fig. 4. Performance evaluation BLADE using simulation data with diverse settings.
a Performances (Pearson correlation coefficient; y-axis) of BLADE (orange), CIBERSORTx (blue), and NNLS (dark red) to predict the cellular fraction of a subset of simulation data with ten cell types, 1000 genes, and various variability levels (standard deviation of 0.1–1.5; x-axis; n = 50 per variability level; five independent data set with ten cell types each). The standard boxplot notation was used (lower/upper hinges—first/third quartiles; whiskers extend from the hinges to the largest/lowest values no further than 1.5 * inter-quartile ranges). b, c Performances (Pearson correlation coefficient; y-axis) of BLADE (orange) and CIBERSORTx (blue) to predict gene expression profiles per cell type for all samples jointly (group mode; b) and for each sample separately (high-resolution mode; c) using the same simulation data (n = 50 per variability level; five independent data set with ten cell types each). The standard boxplot notation was used. d Fractions of purified genes in the simulation data with two extreme levels of gene expression variability (left and right panels) by CIBERSORTx in group mode (top) and high-resolution mode (bottom). x- and y-axis represent the number of cell types and samples in the simulation data, respectively.

