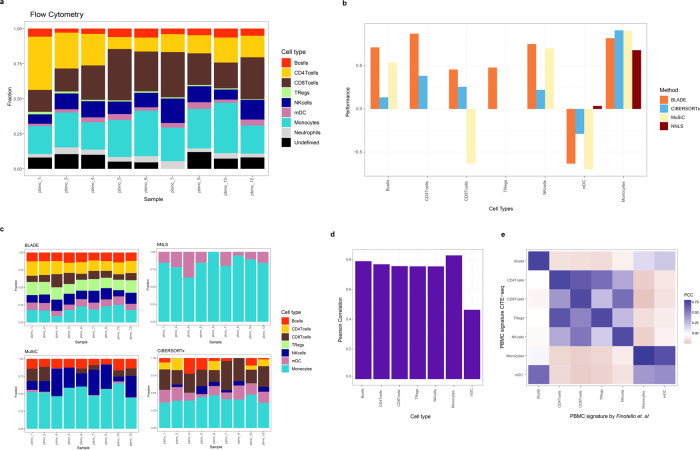
Fig. 6. Performance evaluation of BLADE using PBMC bulk RNA-seq data with incomplete prior knowledge.
a Cell types fractions (y-axis) determined by flow cytometry in nine samples (x-axis). All cell types* have a color associated as shown in the legend. b Performances of BLADE (orange), CIBERSORTx (blue), NNLS (dark red) and MuSiC (light yellow), measured by Pearson correlation (y-axis) of the estimated sample-specific cell type (x-axis) fractions with those determined by flow cytometry. c Estimated cell fractions (y-axis) per sample (x-axis) by BLADE (top-left), NNLS (top-right), MuSiC (bottom-left) and CIBERSORTx (bottom-right). d, e Pearson correlation (y-axis in d and color gradient in e) of the signature per pair of cell types determined by Finotello et al. and two PBMC scRNA-seq data used in this study. *(TRegs: regulatory T cells; NKcells: natural killer cells; mDC: myeloid dendritic cells).

