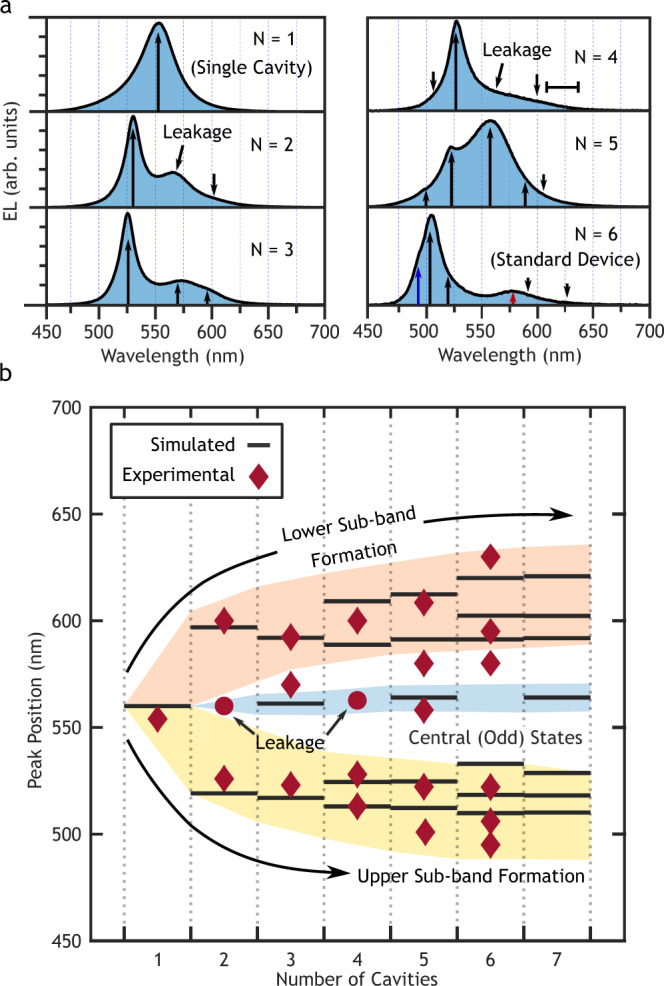
Fig. 2. Emergence of photonic bands.

a Electroluminescence spectra at normal emission for N = 1 → 6 stacked microcavity OLEDs. The highest energy peak at 495 nm had a linewidth of 10.5 nm (blue arrow) while the highest energy peak in the lower sub-band at 578 nm had a linewidth of 47 nm (red arrow). b Computationally simulated and experimentally resolved wavelength of the center of each state in the photonic bands as a function of N. States separate into two sub-bands due to the dual cavity unit cell.
