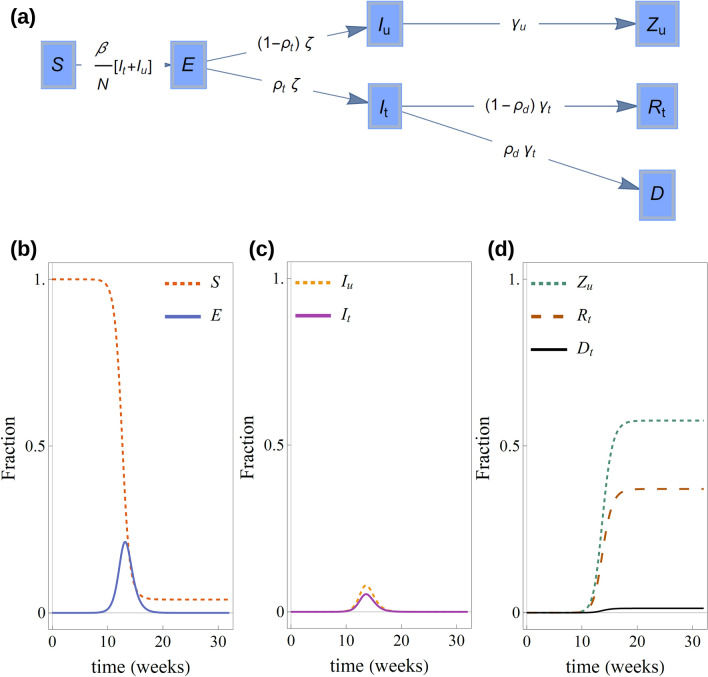
Figure 1.
(a) Flow diagram for the compartment of model 1. Panels (b–d) show a typical time evolution of model variables. As the epidemic progresses, (b) the number of susceptible individuals decreases. The number of exposed individuals initially increases, reaches a peak and decreases at later stages of the epidemic. (c) The progression of the number of both tested and untested infected individuals also exhibits a peak. The decay of and after the peak induces a gradual weakening of the chain of transmission that leads to the end of the epidemic. (d) The number of tested and untested individuals that recover from infection or die increase monotonically during the epidemic.

