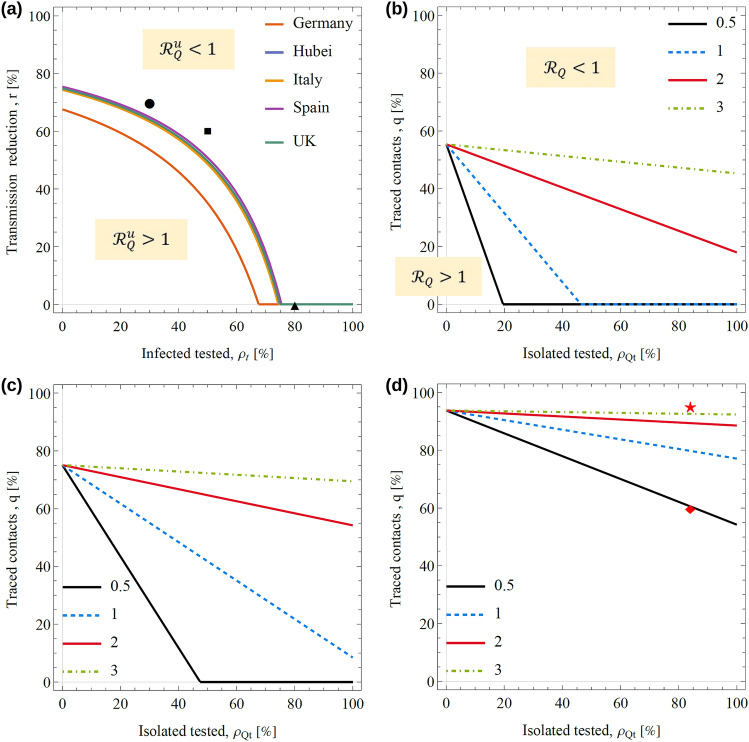
Figure 4.
Suppression of the virus with physicals distance, enhanced testing, isolation and contact tracing. (a) Threshold lines for the reproduction number of untested cases as a function of the testing percentage and reduction of transmission, . For a given country, above the line and below the line. The threshold lines for Italy and Hubei, Spain and UK are close to each other and hardly distinguishable in the plot. Taking the UK as an example, panels (b–d) show the threshold lines for suppression in terms of the isolation and contact tracing percentages of tested cases for different combinations of the testing percentage and reduction of transmission marked by the circle, square and triangle in panel (a). More explicitly, the parameters are in panel (b), in panel (c), and in panel (d). For a given panel, different lines indicate the threshold for different values of the time to isolation, , as marked by the legend. In panel (d), the diamond and star correspond to situations with and , respectively, which were used to simulate the effect of enhanced isolation and contact tracing on the daily deaths in the UK (see Sect. 4 in Additional file 3). All lines show estimates based on the median of the model parameters.

