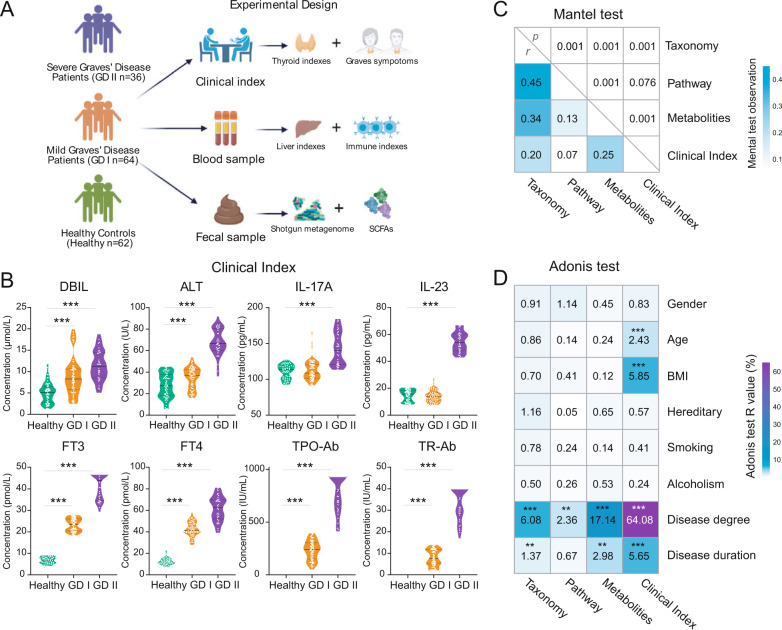
Fig. 1. Experimental design and integrated analysis of the Graves’ disease microbiome.
A The experimental design. A total of 162 human subjects were divided into three groups according to disease states: healthy control (Healthy), mild Graves’ disease (GD I) and severe Graves’ disease (GD II). Shotgun metagenomic sequencing was applied to perform microbiome analyses of fecal samples, while multiple clinical indexes were examined. B The violin plots showing the differential distributions of clinical indexes among three host groups. C The Mantel tests quantifying the correlation between each pair of measurements (taxonomic profile, functional profile, predicted metabolite profile and clinical indexes) from host individuals. The values in the lower triangle indicate the Mantel R statistics, which range from −1 to 1, representing the correlation between a pair of measurements. The corresponding p values of the correlations are shown in the upper triangle. D The Adonis test showed that Graves’ Disease is the dominant factor contributing to the variation in the intestinal microbiome of human subjects. Asterisks: statistical significance (*p ≤ 0.05, **p ≤ 0.01, ***p ≤ 0.001).

