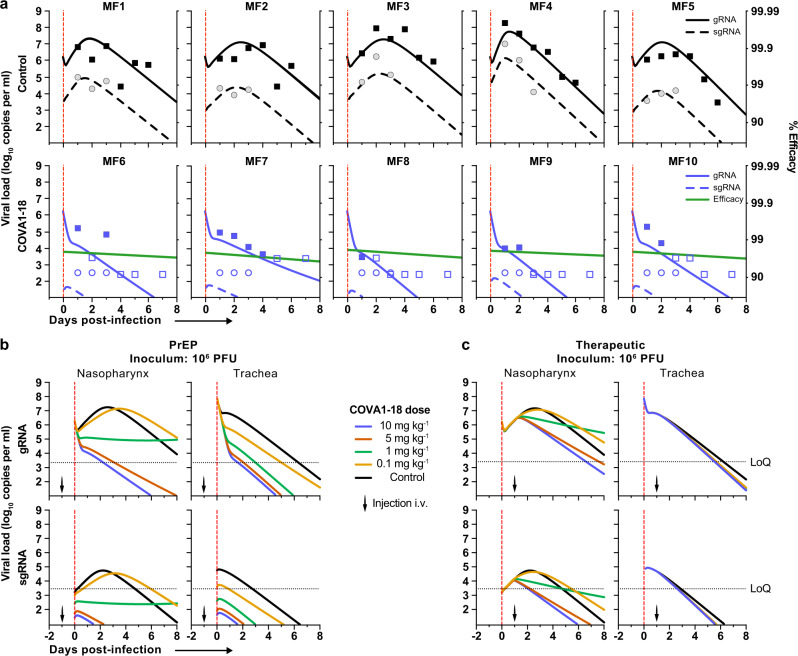
Fig. 4. Modeling of viral dynamics and treatment efficacy.
a Individual prediction of the nasopharyngeal genomic (g)RNA and subgenomic (sg)RNA in control (top) and treated animals (bottom) with individual efficacy prediction indicated (green line). The dashed red line indicates the time of infection. gRNA (squares) and sgRNA (circles) data are indicated as plain (above LoQ) or open (below LoQ). b Model predictions of gRNA and sgRNA dynamics with 4 doses of COVA1-18 given 24 h prior to challenge (arrow). c Simulation as in (b) with COVA1-18 given 24 h post-infection. Black dotted lines indicate LoQ (limit of quantification), i.v. intravenous, PFU plaque forming units, PrEP Pre-exposure prophylaxis.

