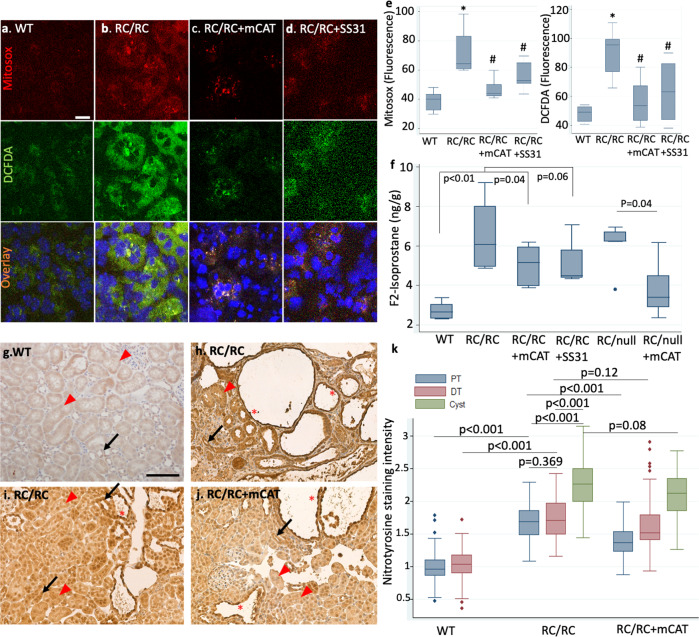
Fig. 8. ROS and oxidative damage in RC/RC kidneys.
Representative images of ex vivo live staining of kidney slices with MitoSOX (top row), an indicator of mitochondrial superoxide and DCFDA (middle row), an indicator of total cellular ROS, overlaid with Hoechst 33342 (bottom row) in kidneys from a WT and b RC/RC mice or RC/RC mice treated with c low dose AAV9-mCAT (RC/RC + mCAT) or d the mitochondrial protective peptide SS31; n = 3−4 per group (scale bar: 25 µm). e Quantification of ROS from cells treated as in (a–d). f Concentration of F2-isoprostane, a marker of lipid peroxidation in kidney tissue of WT, RC/RC, RC/RC treated with mCAT or SS31, RC/null and RC/null treated with mCAT, measured by high-performance liquid chromatography; n = 4−6. *p < 0.01 vs. WT; #p < 0.05 vs. RC/RC. IHC staining for nitrotyrosine in g WT, h, i RC/RC, and j RC/RC treated with AAV9-mCAT and k quantification of nitrotyrosine staining intensity as in (g–j). (Scale bar: 100 µm); PT: red arrowhead, DT: black arrow, *: cysts; n = 3 per group; PT: proximal tubule, DT: distal tubule.

