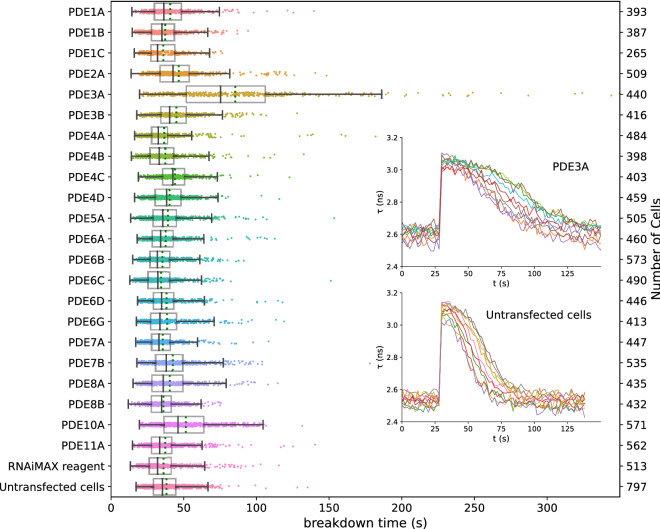
Figure 4.
Decay time of donor lifetime signals following UV-uncaging of cAMP in cells treated with siRNAs for the indicated PDEs. Note significantly slower breakdown upon knockdown of PDE3A, and a smaller, but still significant contribution of PDE10A. Datapoints are fitted decay times of single cells. For each condition, the experiment was performed in duplicates, with cells grown, transfected, and assayed in two independent wells. Indicated are median value (vertical black line), mean value (green dotted line); boxes encompass middle 50% of values and whiskers represent 1.5 times the interquartile range. Inset: 10 representative traces for cAMP decay in Hela cells with PDE3A gene knock-down (upper panel) and control (lower panel) cells. Cells were imaged every 2 s; uncaging at 25 s using a 200 ms flash of UV light.

