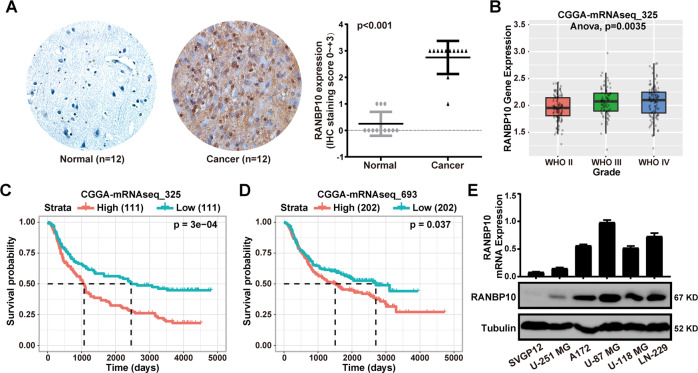
Fig. 1. RANBP10 was highly expressed in GBM and was associated with the poor prognosis of GBM patients.
A Immunohistochemical analysis of RANBP10 expression in 12 paired samples of glioblastoma and normal brain tissue, P < 0.001. B Box plot of RANBP10 expression levels in WHO II, WHO III, and WHO IV glioma set with the log-rank test P values indicated. C, D Kaplan–Meier analysis of overall survival using data from the CGGA-mRNAseq-325 and CGGA-mRNAseq-693 dataset and P values were indicated. E RT-PCR analysis and western blot analysis of RANBP10 expression in normal SVGP12 cells and glioblastoma cell lines. The data were expressed as mean ± SD. Student’s t test was performed to analyzed significance.

