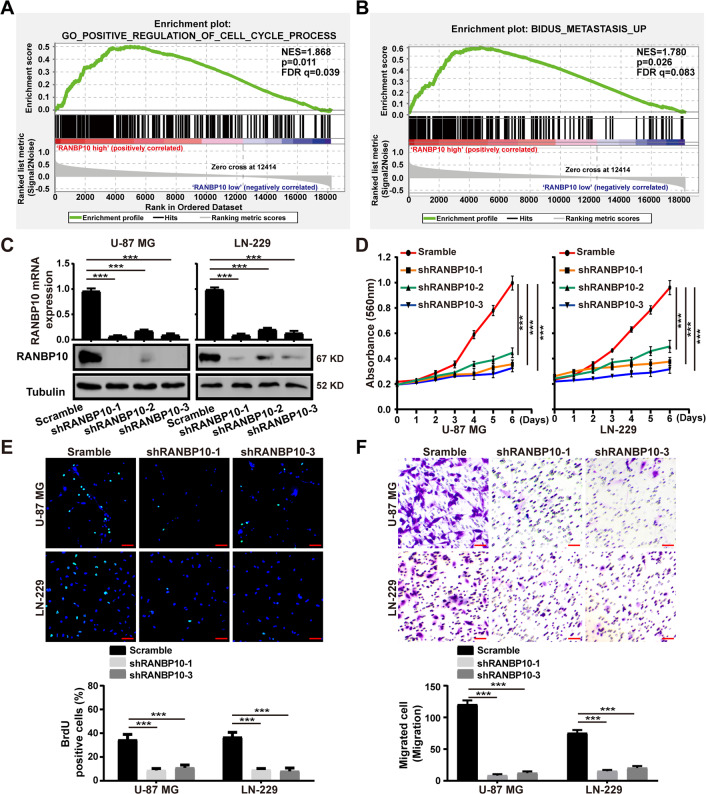
Fig. 2. Silencing of RANBP10 inhibited cell proliferation, migration, and invasion of GBM cells.
A, B GSEA enrichment analysis of cell cycle process and metastasis signatures in RANBP10 high expression versus RANBP10 low expression CGGA gliomas, Normalized enrichment score (NES), P values, and false discovery rate (FDR) were indicated. C RT-PCR analysis and western blot analysis were used to detect the mRNA and protein expression level of RANBP10 in RANBP10-knockdown and control cells. D Cell proliferation of RANBP10-knockdown and control cells were examined by MTT assay. E BrdU staining assays were performed to detect the amount of DNA synthesis in RANBP10 downregulation and control cells. Scale bar = 50 μm. F Cell migration of RANBP10-knockdown and control cells were examined by transwell assay. Scale bar = 50 μm. The data were expressed as mean ± SD. Student’s t test was performed to analyzed significance. *P < 0.05, **P < 0.01, ***P < 0.001.

