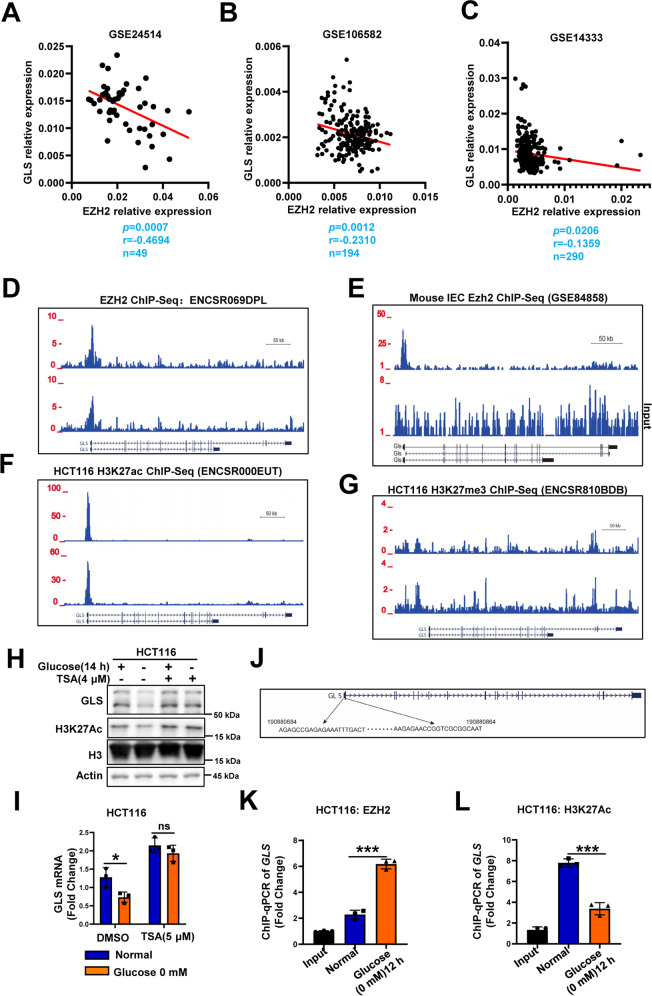
Fig. 4. GLS is a direct target gene of EZH2 in colorectal cancer cells.
A–C Scatter plots showing the correlation between EZH2 and GLS mRNA levels in human colorectal cancer (GSE24514, GSE14333, and GSE106582). Statistical analysis was performed using a two-tailed Student’s t-test. r, Pearson’s correlation coefficient. D Schematic representation of the binding site of human EZH2 in GLS promoter as mapped in ENCODE database (ENCSR069DPL). E Schematic representation of the binding site of mouse EZH2 in Gls promoter of primary colon epithelial cells isolated from wild-type mice (GSE84858). F, G Schematic representation of the binding of H3K27ac (F) and H3K27me3 (G) on the GLS gene locus in HCT116 cells with the ENCODE project. H, I WB and RT-qPCR of GLS levels in CRCs pretreated with DMSO or HDAC inhibitor (TSA, 4 μM), followed by glucose deprivation treatment (0 mM, 16 h). J Location of ChIP-qPCR primers on GLS promoter. K, L ChIP-qPCR analysis of EZH2 and H3K27Ac on GLS promoter in HCT116 cells with or without glucose deprivation treatment (0 mM, 12 h). In I, K, and L, data are mean ± s.d., n = 3 independent experiments; P-values were calculated using two-tailed unpaired Student’s t-test. *P < 0.05, **P < 0.01, ***P < 0.001; ns, non-significant.

