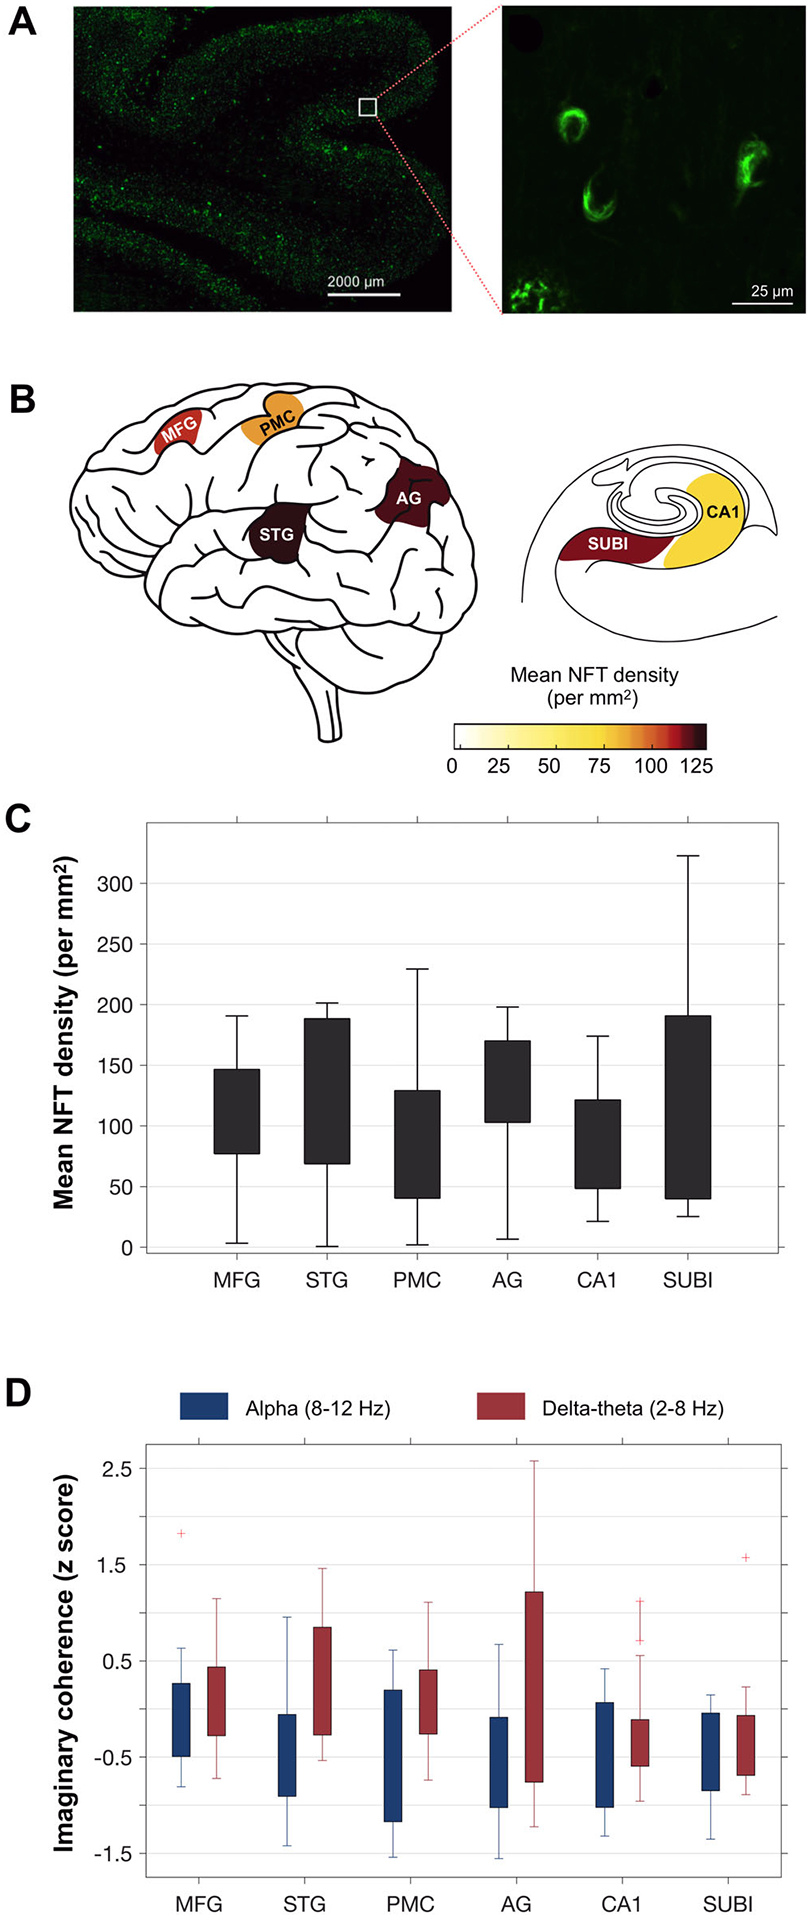
FIGURE 1.

Estimation of regional neurofibrillary tangle (NFT) densities and frequency-specific neuronal synchrony deficits: Regional tau NFT densities were quantified via thioflavin-S fluorescent microscopy (A), where NFT pathology is distinguished by flame-shaped or globose morphology of fibrous aggregates (A-inset). Mean NFT densities per mm2 were estimated for six regions, including angular gyrus (AG), primary motor cortex (PMC), superior temporal gyrus (STG), middle frontal gyrus (MFG), hippocampus-CA1 (CA1), and subiculum (SUBI), in patients with Alzheimer’s disease (AD; B-C). For each region, the degree of neuronal synchrony was quantified within alpha (8–12 Hz) and delta-theta (2–8 Hz) oscillatory bands (D). Neuronal synchrony is depicted as the average imaginary coherence estimate per each region, normalized based on an age-matched healthy control population. (n = 13, patients with AD; n = 23 age-matched controls)
