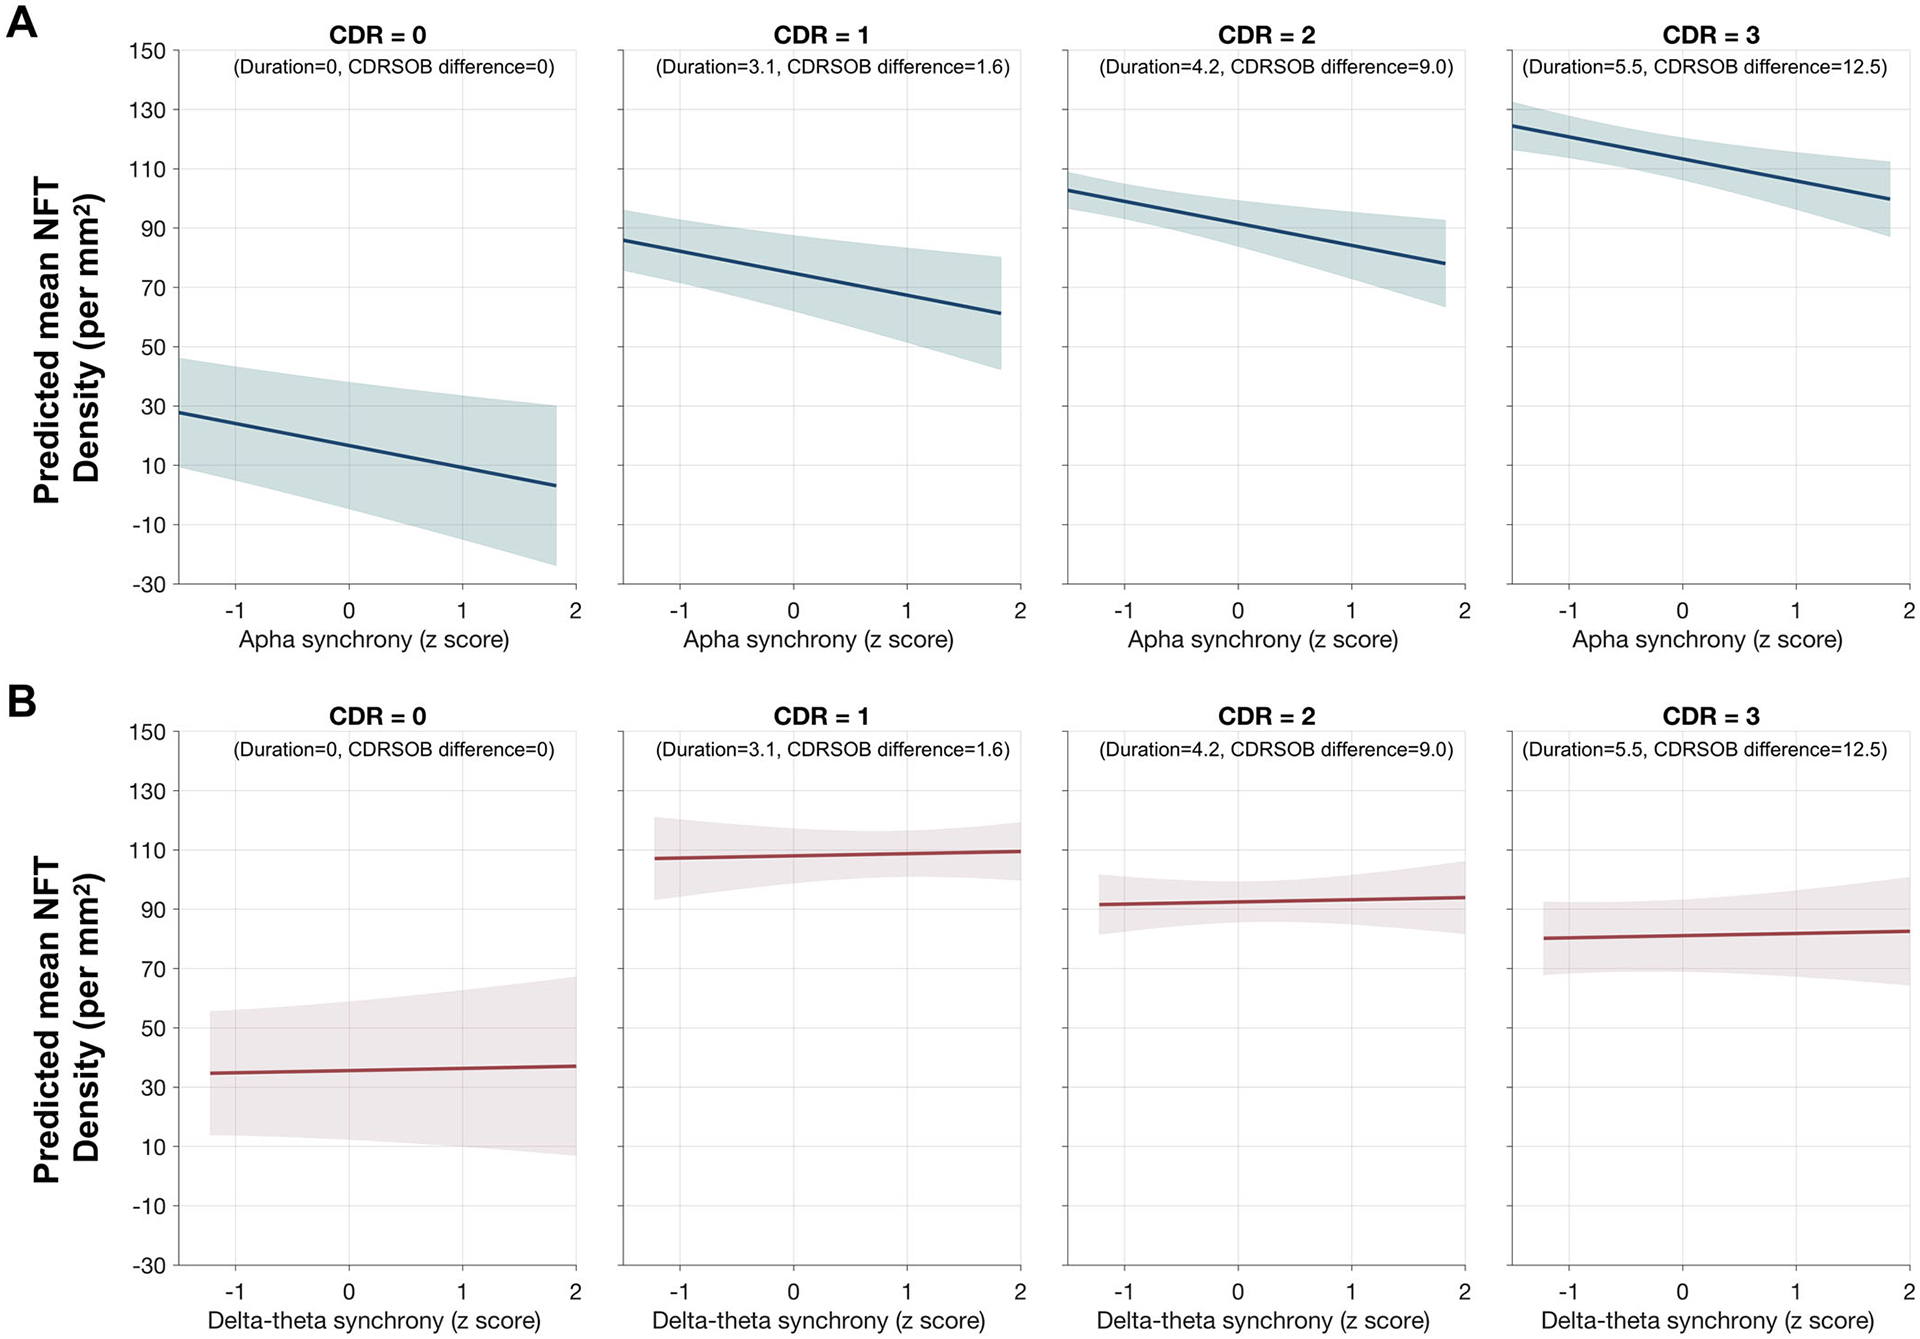
FIGURE 3.

Predictions of neurofibrillary tangle (NFT) density by frequency-specific neuronal synchrony deficits at different degrees of functional severity at death in patients with Alzheimer’s disease (AD): Estimates from linear mixed-effects models predicting the NFT burden by alpha (8–12) synchrony deficits (A) and delta-theta (2–8 Hz) synchrony deficits (B), in patients with AD. From left to right each subplot depicts model fits computed at varying combination of Clinical Dementia Rating (CDR) at death and Clinical Dementia Rating Sum of Boxes (CDR-SOB) difference as such to represent increasing functional deficits. For example, the left most subplot is computed at the CDR = 0 and CDR-SOB difference = 0, while the next three subplots from left to right are computed at first quartile (Q1), median and the third quartile (Q3) values for CDR-SOB difference from magnetoencephalography (MEG) to death and duration from MEG to death
