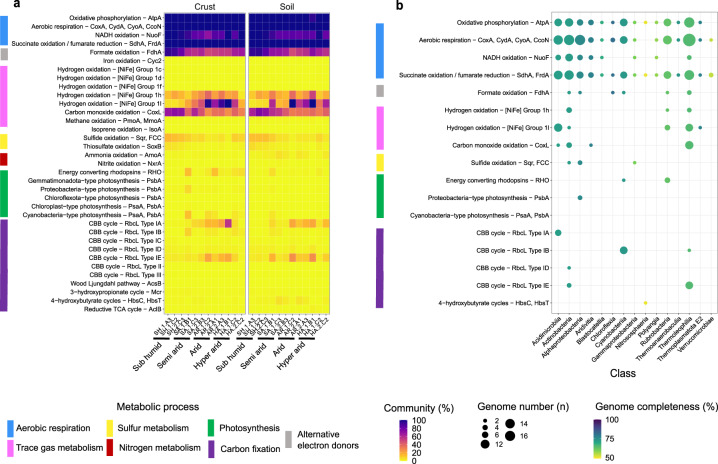
Fig. 2. Distribution of energy and carbon acquisition genes in biocrust and topsoil microbial communities sampled along the aridity gradient.
a Heatmap showing the abundance of metabolic marker genes in the metagenomic short reads. The percentage of the total community predicted to encode at least one of each gene for a process is shown, based on normalization to single-copy marker genes. b Dot plot showing the metabolic potential of the 68 metagenome-assembled genomes (MAGs). The size of each point represents the number of genomes in each phylum that encode the gene of interest and the shading represents the average genome completeness.

