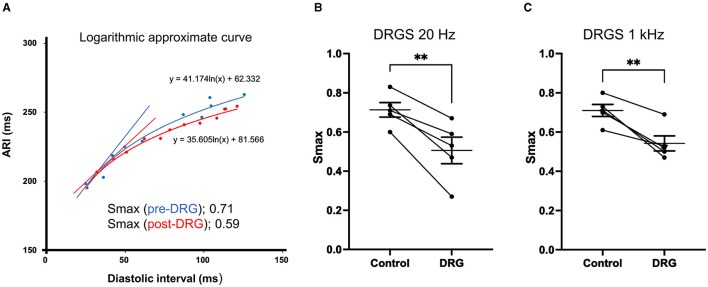
Figure 5.
Representative electrical restitution curve and global ventricular maximum slope (Smax). (A) Representative figure of electrical restitution curve showing the decrease in maximum steep slope (Smax) after 30 min of dorsal root ganglion stimulation (DRGS) compared to pre-DRG. Thirty min of DRGS at 20 Hz or 1 kHz decreased Smax with significant differences [**P = 0.0061 at 20 Hz on the left figure (B), **P = 0.0069 at 1 kHz on the right figure (C)]. The data are reported as mean ± standard error (SE).

