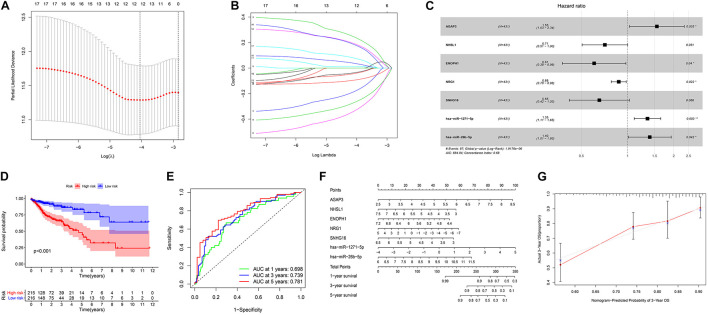
FIGURE 3.
(A) Lasso regression analysis to screen prognostic-related genes. (B) Calculating the risk score of each patient and establishing the risk model. (C) Cox regression analysis of seven RNAs. (D) Comparison of prognostic differences between the high- and low-risk groups divided by the model. (E) Evaluation efficacy of the risk model at 1, 3, and 5 years. (F) Visual display of the nomogram patient prognosis evaluation model. (G) A 3-year evaluation efficacy of the nomogram model.

