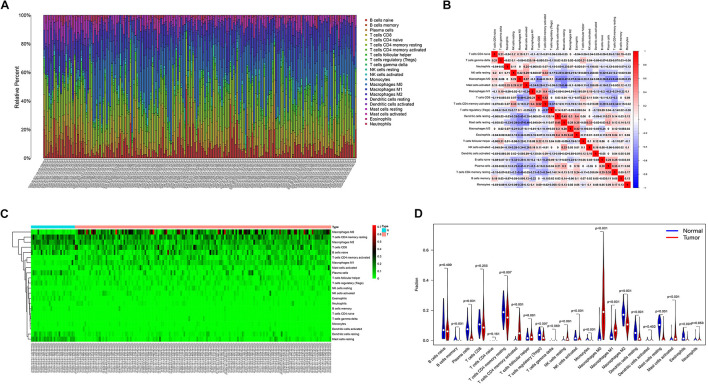
FIGURE 4.
(A) Histogram of the infiltration ratio of the 22 immune cells in tumor tissue. (B) Correlation analysis of the respective expression levels of the 22 immune cells in the tumor sample. (C) Heatmap of the difference of immune cell infiltration between cancer tissue and normal tissue adjacent to cancer. (D) Violin image of the difference of immune cell infiltration difference between cancer tissue and normal tissue adjacent to cancer.

