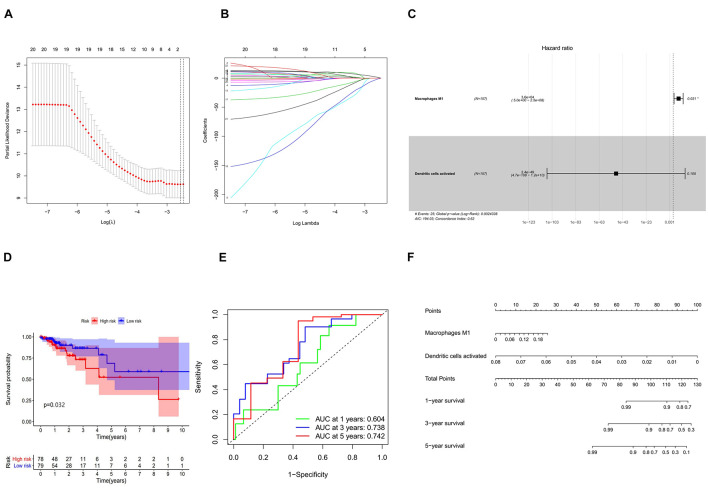
FIGURE 7.
(A) Lasso regression analysis to screen immune cells related to prognosis. (B) Calculating the risk score of each patient and establishing the risk model. (C) Cox regression analysis of two prognostic-related immune cells. (D) High and low risk of immune cell model comparison of the prognosis of patients in the group. (E) The evaluation efficiency of the risk model at 1, 3, and 5 years. (F) The visual display of the nomogram patient prognosis evaluation model.

