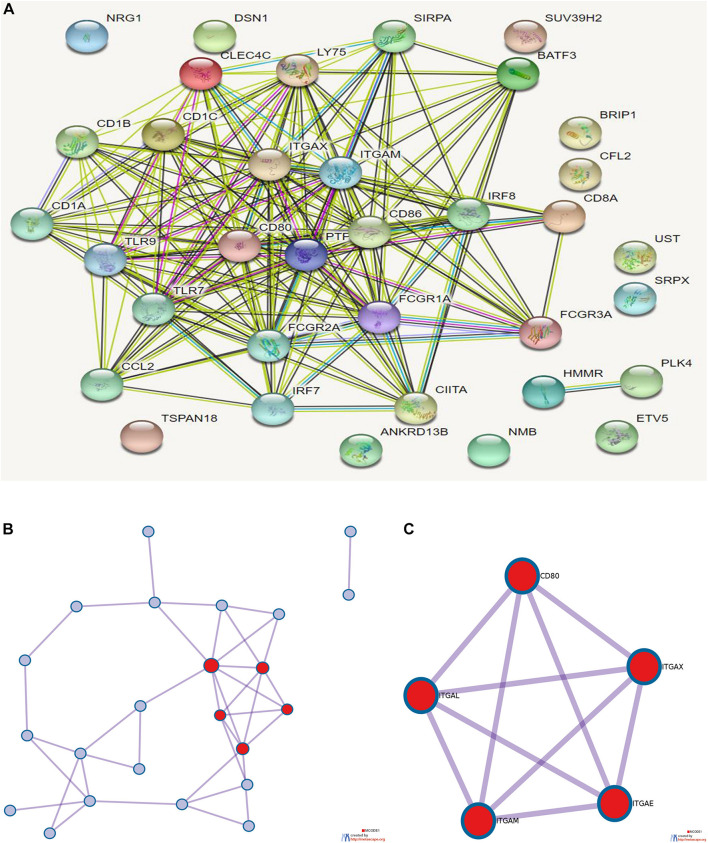
FIGURE 9.
(A) Protein interaction analysis results of prognostic-related genes. (B) Topological network of protein interaction analysis results. (C) Core genes screened by protein interaction analysis. qPCR detection of the seven core RNAs in phases I and III and differential expression in tissues of patients with colon cancer and normal tissues.

