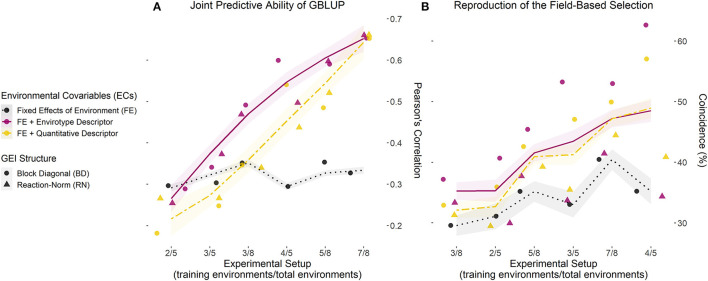
Figure 3.
Joint accuracy trends of GP models for each training setup of existing experimental networks. (A) Predictive ability computed with the correlation (r) between observed (y) and predicted (ŷ) values for the grain yield of each genotype in each environment, over three experimental setups (number of environments used/total of environments) for both maize sets (N-level and multilocal), using 70% of the genotypes as a training set and the remaining 30% as a testing set. (B) Coincidence index (CS) between the field-based and prediction-based selection of the best 5% genotypes in each environment for the same experimental setups and data sets. Dots and triangles represent the point estimates of predictive ability and CS for models involving a block diagonal genomic matrix for G × E effects (dotted) and an enviromic × genomic reaction norm G × E effect (triangle). Trend lines were plotted from the partial values of each sample (from 1 to 50) and three prediction scenarios (nG, E; G, nE; and nG, nE) using the gam () integrated with smoothness estimation in R. Black dotted lines represent the benchmark GBLUP method, considering the effect of the environment as a fixed intercept. Yellow two-dash lines represent the GBLUP involving the main effect from quantitative descriptors (W matrix). Finally, solid dark pink lines represent the GBLUP involving the main effect of envirotype descriptors (T matrix). Thus, the latter represents the E-GP based approach for Case 1 (predictions under existing experimental networks).

