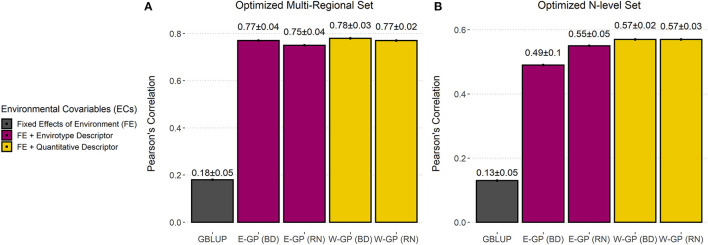
Figure 4.
Accuracy of GP models trained with super-optimized experimental networks. Predictive ability (r) plus standard deviation measured by the correlation between observed and predicted values for each model in (A) the optimized multiregional set and for (B) the N-level set. Bar plots were colored according to the type of environmental covariable (ECs) used: none (black), envirotype descriptor (T matrix, wine), and quantitative descriptor (W matrix, yellow).

