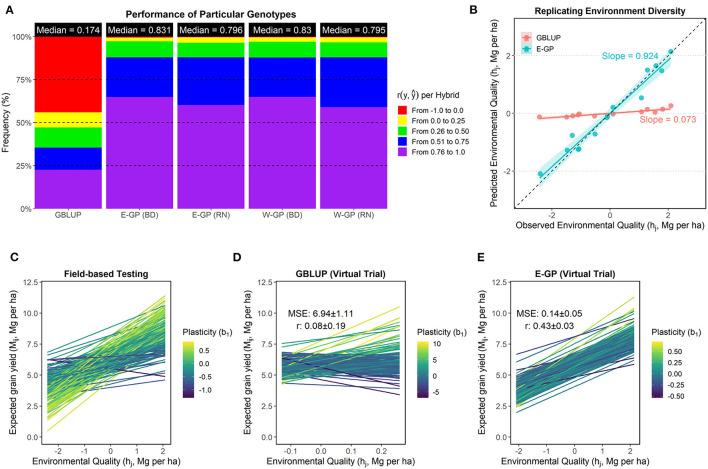
Figure 5.
Accuracy of GP models in reproducing the genotype-specific plasticity. (A) Panel of predictive ability (r) explaining the plasticity of genotypes across environments. This statistic was estimated for each individual (hybrid) by correlating observed and predicted values across the environments. Individuals with values below 0 were considered unpredictable and marked in red. (B) Ability of the prediction-based tools to reproduce the quality of an existing experimental network (hj). In the X-axis, we computed hj using the phenotypic records of a current experimental network. In the Y-axis, the hj values are presented considering a virtual experimental network built using GBLUP and E-GP (with BD) predictions. (C–E) Yield plasticity panels denoting G × E effects of each genotype across the hj values for observed field testing screening (C) concerning prediction-based (D,E). Only the 5% best genotypes in each environment were used to create this plot. Each line was colored with the genotype-specific plasticity coefficient (b1). For the N-level set, the full-optimized set (536 hybrids over eight environments) was used.

