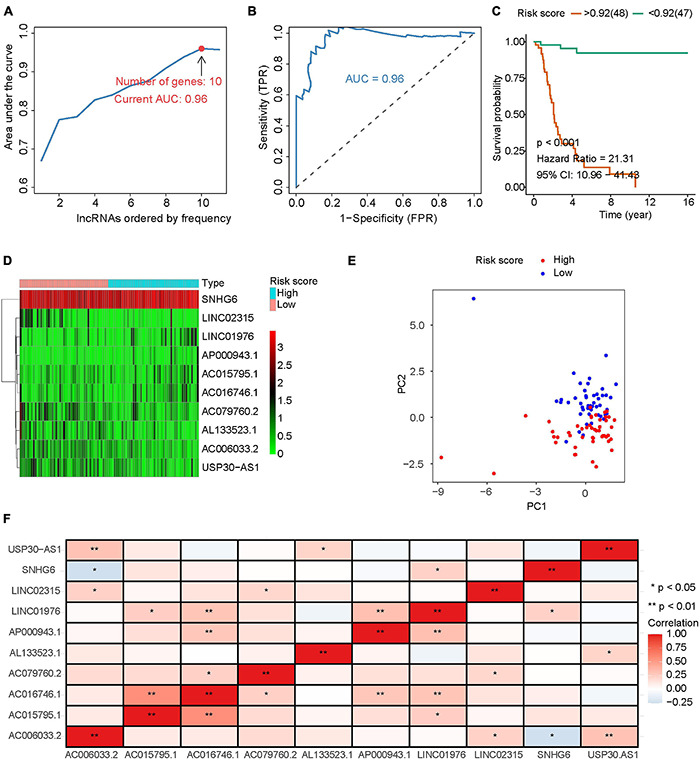
FIGURE 1.

Construction of IRLs prognostic signature. (A) Iterative LASSO and Cox regression analysis are used to screen IRLs signature with the best AUC. (B) The ROC curve with the best AUC. (C) Osteosarcomas were grouped according to the optimal cut-off value of risk score, and survival analysis was performed. (D) Expression levels of 10 lncRNA in IRLs signature. (E) PCA analysis was performed with IRLs signature. (F) Correlation analysis among 10 IRLs in IRLs signature.
