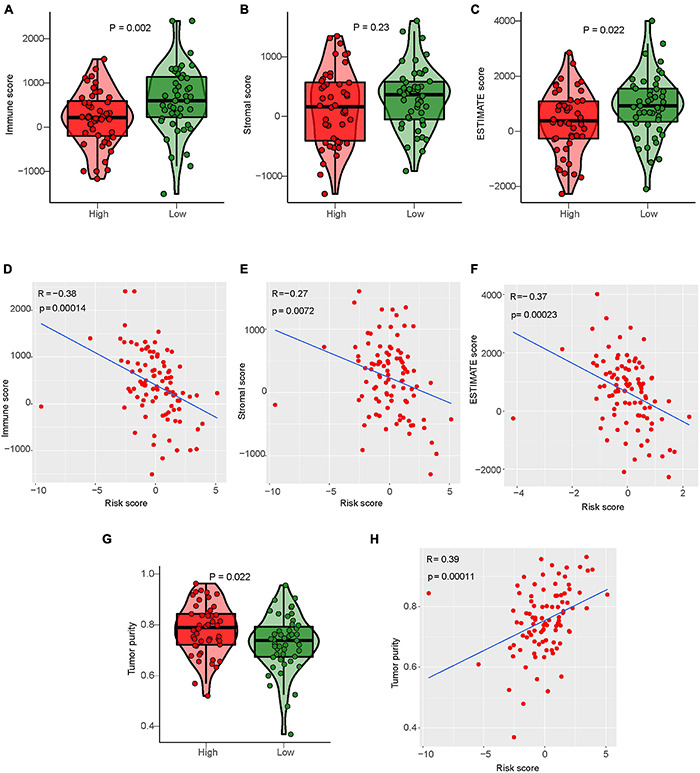
FIGURE 9.

Relationship between IRLs signature and tumor microenvironment score. (A–C) Analysis of differences in the immune score, stromal score, and Estimate score between high-risk and low-risk osteosarcoma. (D–F) Correlation analysis between risk score and osteosarcoma immune score, matrix score, and Estimate score. (G) Analysis of difference in tumor cell purity between high-risk and low-risk osteosarcoma. (H) Correlation analysis between risk score and tumor cell purity of osteosarcoma.
