
Figure 2.
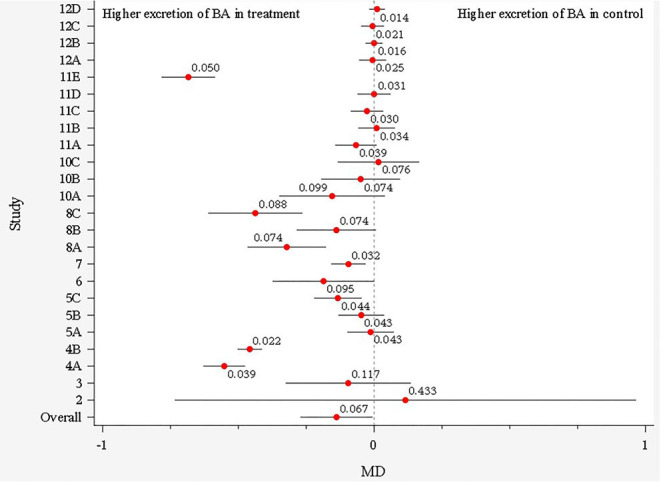
Forest plot showing the main difference (MD) and its 95% CI for each study before outlier removal. Each study is represented by a number and letters represent different soluble fiber treatments within each study.
Official websites use .gov
A
.gov website belongs to an official
government organization in the United States.
Secure .gov websites use HTTPS
A lock (
) or https:// means you've safely
connected to the .gov website. Share sensitive
information only on official, secure websites.
Forest plot showing the main difference (MD) and its 95% CI for each study before outlier removal. Each study is represented by a number and letters represent different soluble fiber treatments within each study.