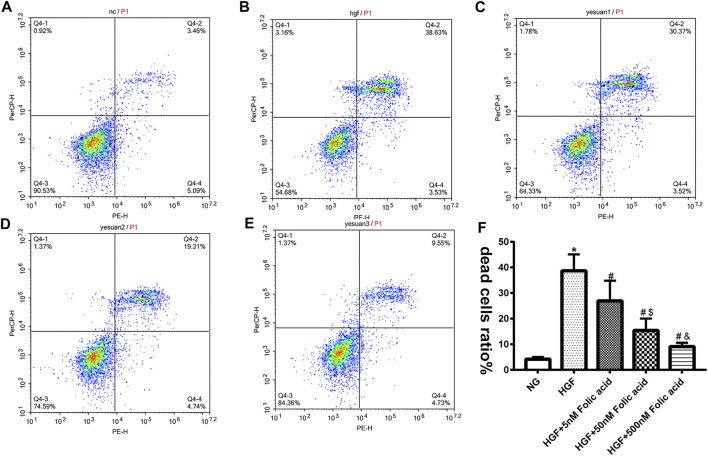
FIGURE 3.
Effect of folic acid on the ratio of dead cells. (A–E) Representive flow cytometry plots showing percentage of dead cells treated with NG, HGF, 5–500 nM folic acid and HGF (F) Percentage of Annexin V and 7-AAD positive cells. * p < 0.05, compared with NG; # p < 0.05, compared with HGF; & p < 0.05, compared with HGF+50 nM folic acid.

