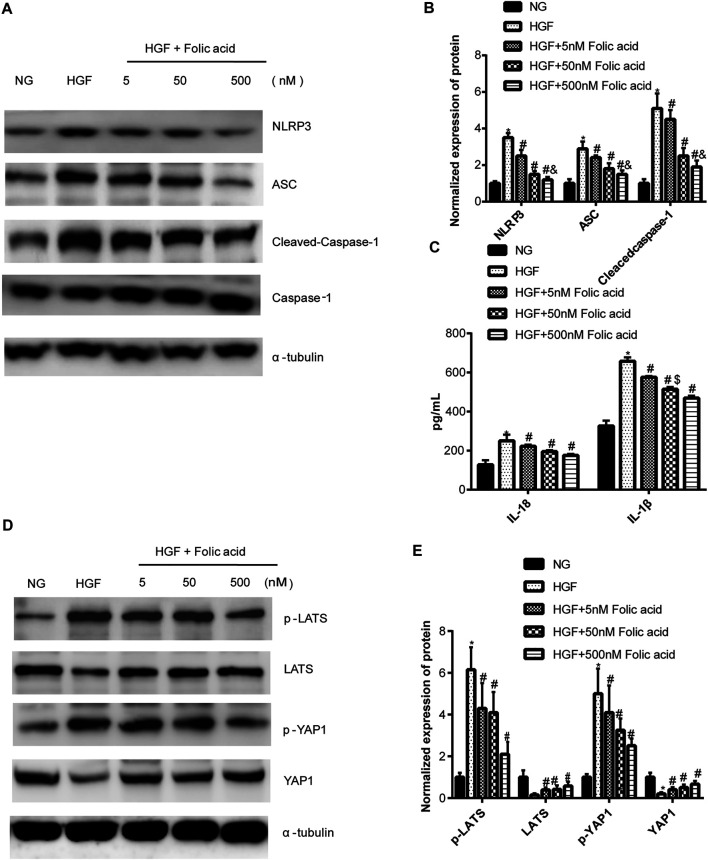
FIGURE 4.
Effect of folic acid on the pyroptosis and Hippo signaling pathway. (A) Representative immunoblot showing expression levels of NLRP3, ACS, Cleaved-Caspase-1 and Caspase-1. (B) Quantification of NLRP3, ACS, Cleaved-Caspase-1 and Caspase-1 with α-tubulin as the loading control. (C) IL-1β and IL-18 levels in the cell supernatant. (D) Representative immunoblot showing expression levels of YAP1 and p-YAP1. (E) Quantification of YAP1 and p-YAP1 with α-tubulin as the loading control. * p < 0.05, compared with NG; # p < 0.05, compared with HGF; & p < 0.05, compared with HGF+50 nM folic acid.

