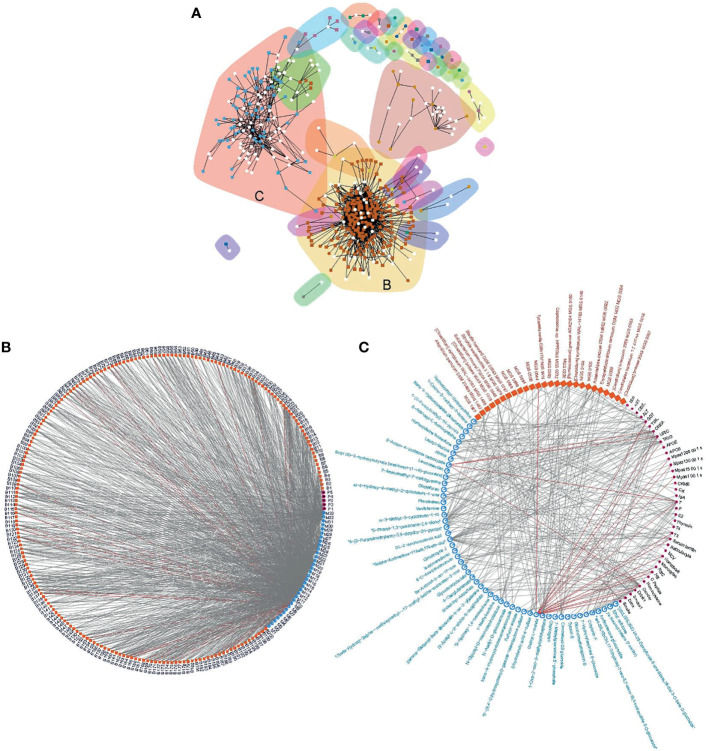
Figure 5.
Correlation communities. Community modeling based on connectivity revealed two distinct communities (A), including a large community composed of dense microbe-metabolite correlations (B), and a microbe-metabolite-phenotype triangular correlated community (C). Edge denotes correlation at q<0.1 and coefficient ≥ 0.3. The largest community (B) was formed by 1049 edges of which 99.1%were between MGS and metabolites (MGS and metabolites are coded, Additional File 15: Table S10). The second largest community (C) was formed by 270 edges where the majority of the three domains were connected. Grey lines, positive correlations; red lines, negative correlations.

