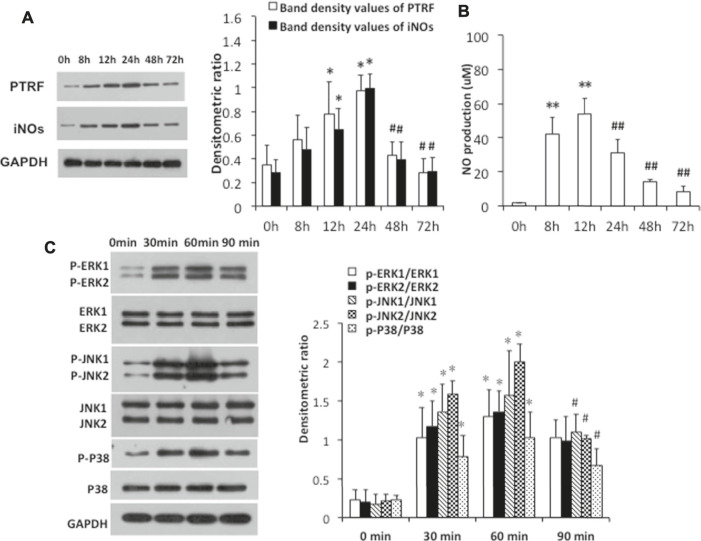
FIGURE 2.
LPS-induced PTRF expression and iNOs pathway activation in HCoEpiCs. The cells were stimulated with LPS (5 μg/ml) for the indicated time intervals. (A) Cell lysates were blotted with anti-PTRF and anti-iNOs. The relative expressions were standardized to the endogenous control GAPDH. Left: Representative images of PTRF and iNOs expression; an antibody for GAPDH was used to show equal protein loading; right: bar graphs show quantitative evaluation (n = 3). Data are reported as the mean ± S.D., *p < 0.05 compared with 0 h, and # p < 0.05 compared with 24 h. (B) Nitric oxide (NO) production from supernatants of the cells was measured by ELISA. Data are reported as the mean ± S.D. n = 10, **p < 0.01 compared with 0 h, and ## p < 0.01 compared with 24 h. (C) Cell lysates were blotted with anti-p38/phospho-p38, anti -ERK/p-ERK, and anti-JNK/p-JNK. The relative expressions were standardized to the endogenous control GAPDH. Left: representative images of p38/phospho-p38, ERK/p-ERK, and JNK/p-JNK blots; an antibody for GAPDH was used to show equal protein loading; right: bar graphs show quantitative evaluation (n = 3). Data are reported as the mean ± S.D., *p < 0.05 compared with 0 min, and # p < 0.05 compared with 60 min.

