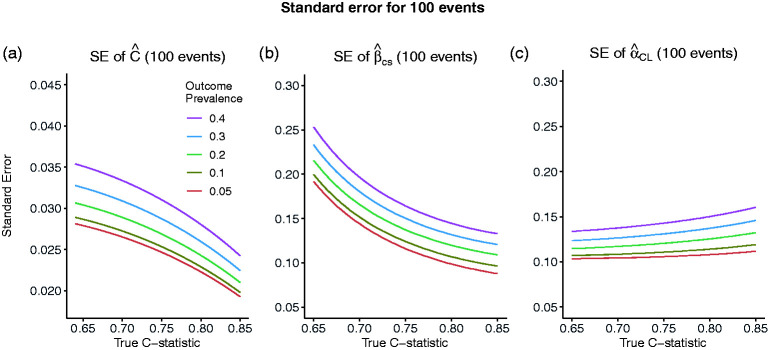
Figure 1.
Standard error of the estimated C-statistic (a), calibration slope (b) and calibration in the large (c) as the true value of the C-statistic varies and the number of events is fixed to 100, corresponding to sample sizes of 2000, 1000, 500, 334 and 250 for outcome prevalences of 0.05, 0.1, 0.2, 0.3 and 0.4, respectively.
SE: standard error.

