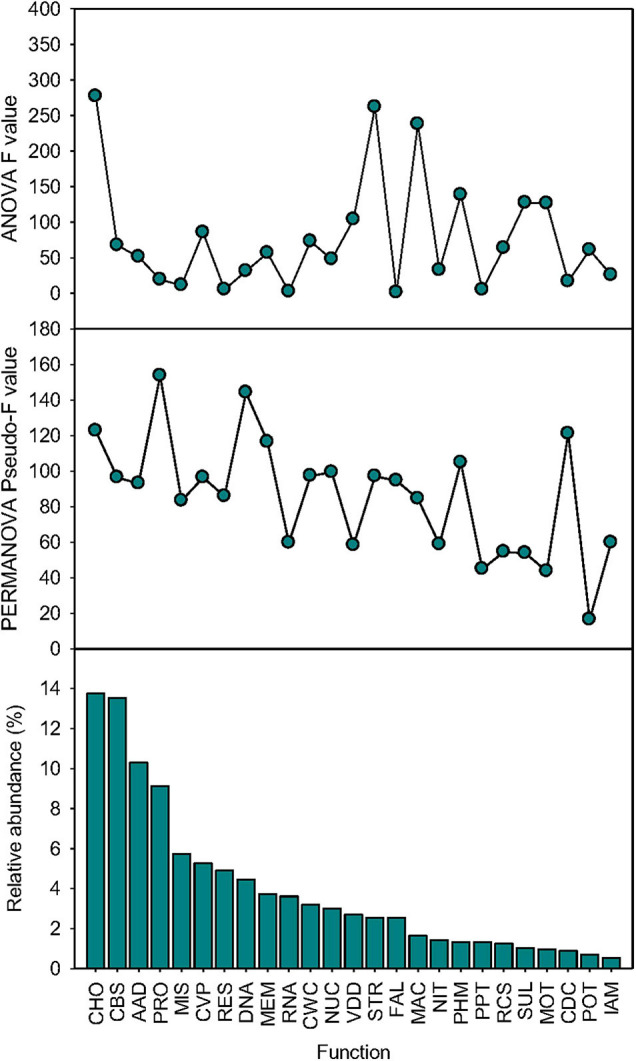
FIGURE 5.

Function-specific effects. The ANOVA statistical significance (F value), the PERMANOVA statistical significance (pseudo-F value), and relative abundance of 25 dominant functional categories at level 1 (mean > 0.5%) influenced by sequential species loss. AAD, amino acids and derivatives; CBS, clustering-based subsystems; CDC, cell division and cell cycle; CHO, carbohydrates; CVP, cofactors, vitamins, prosthetic groups, pigments; CWC, cell wall and capsule; DNA, DNA metabolism; FAL, fatty acids, lipids, and isoprenoids; IAM, iron acquisition and metabolism; MAC, metabolism of aromatic compounds; MEM, membrane transport; MIS, miscellaneous; MOT, motility and chemotaxis; NIT, nitrogen metabolism; NUC, nucleosides and nucleotides; PHM, phosphorus metabolism; POT, potassium metabolism; PPT, phages, prophages, transposable elements, plasmids; PRO, protein metabolism; RCS, regulation and cell signaling; RES, respiration; RNA, RNA metabolism; STR, stress response; SUL, sulfur metabolism; and VDD, virulence, disease, and defense.
