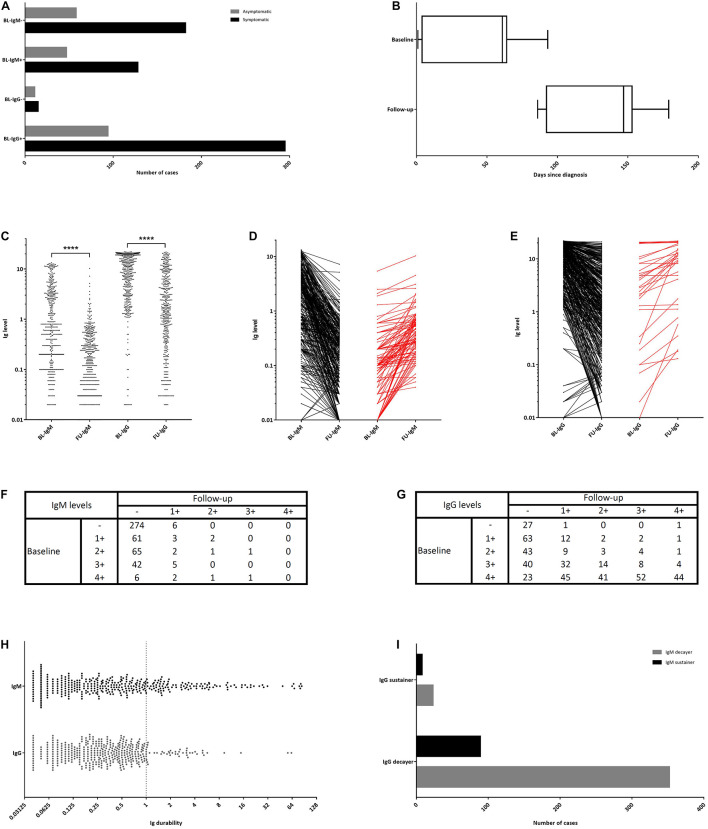
FIGURE 1.
The time course of the baseline (BL) and follow-up (FU) blood sampling and the dynamics of the anti-SARS-CoV-2 seropositivity and symptom changes. (A) The number of symptomatic and asymptomatic subjects in each IgM/IgG negative/positive subgroup. (B) The time-course of the baseline as well as the FU interview and serologic testing. (C) IgM and IgG antibody levels at the baseline and FU. (D) The extent of antibody level change in IgM decayers (black) and IgM sustainers (red). (E) The extent of antibody level change in IgG decayers (black) and IgG sustainers (red). (F) The extent of IgM level change in semiquantitative form. (G) The extent of IgG level change in semiquantitative form. (H) IgM and IgG durability. (I) The number of IgM and IgG sustainers and decayers. (– [negative]: <1.10, 1+: 1.10–2.99, 2+: 3.00–5.99, 3+: 6.00–11.99, and 4+: ≥12.00). ****unpaired two-tailed Student’s t-test, P < 0.0001.

