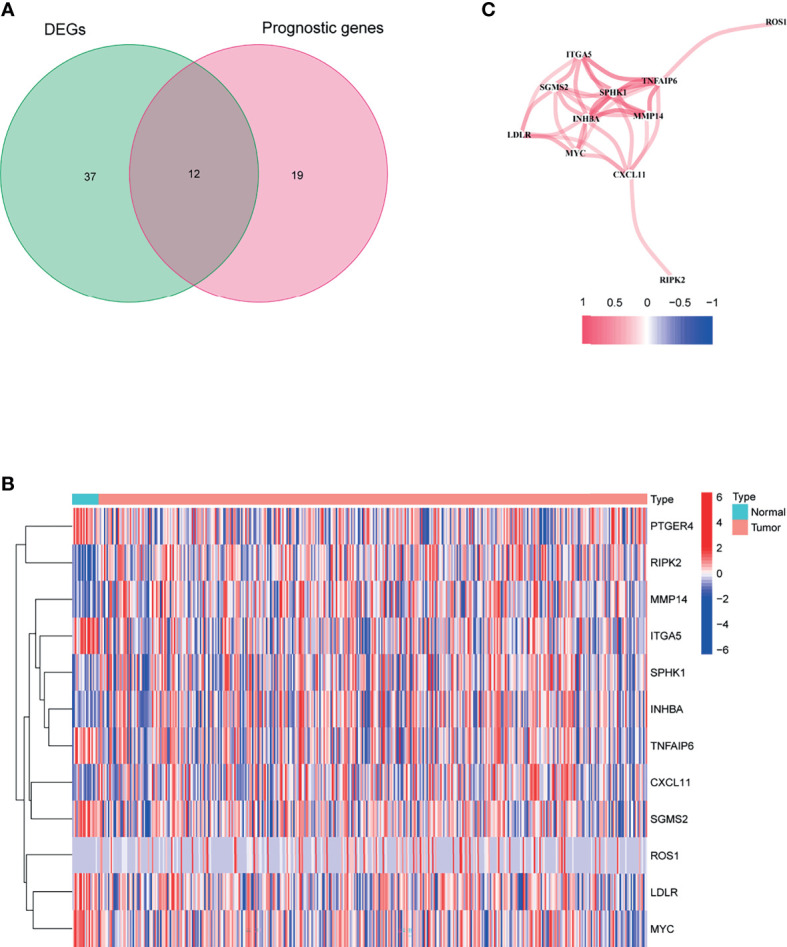
Figure 2.

Identification of the candidate inflammatory response-associated genes in the TCGA cohort. (A) Venn diagram to identify DEGs between BLCA tissues and adjacent normal tissues. (B) The 13 overlapping genes expression between BLCA tissues and adjacent normal tissues. (C) The correlation network of candidate genes.
