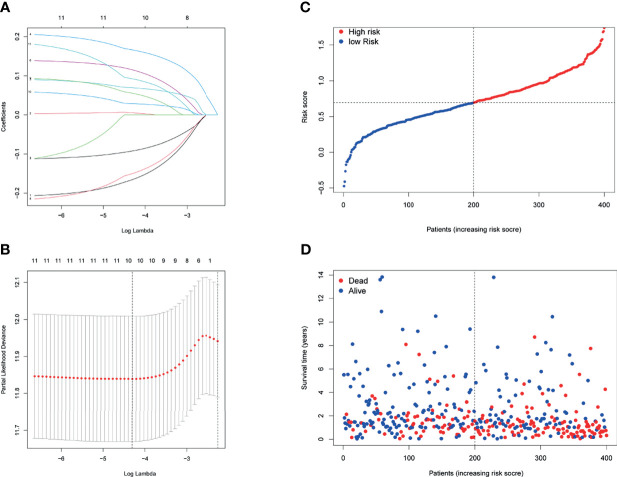
Figure 3.
Prognostic analysis of the 10-gene signature model in the TCGA cohort. (A) LASSO coefficient expression profiles of 13 candidate genes. (B) The penalty parameter (λ) in the LASSO model was selected through 10 cross-validation. (C) The median value and distribution of the risk scores. (D) The distribution of OS status.

