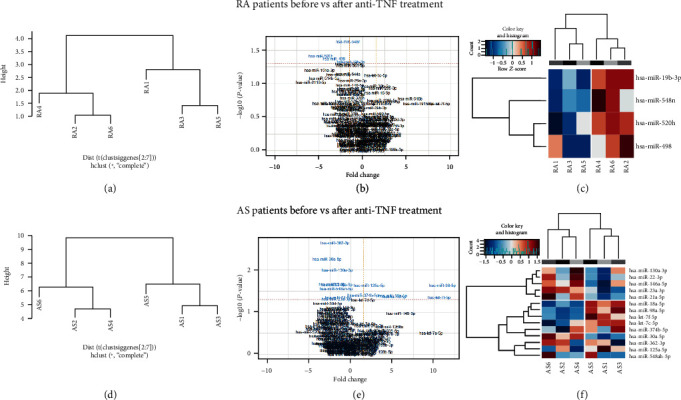
Figure 1.

Serum EV microRNA expression in RA and AS patients before vs. after anti-TNF treatment. (a, d) Unsupervised hierarchical clustering analysis. Samples before (1, 3, and 5) vs. after (2, 4, and 6) anti-TNF therapy. (b, e) Volcano plots showing the relationship between fold change and significance for RA and AS patients before and after anti-TNF therapy. The horizontal dashed line indicates cutoff for significance p < 0.05 (−log10 p value > 1.3) and the vertical lines for fold change ≥ 1.5/≤−1.5. Significantly different miRNAs are highlighted in blue. (c) Heatmaps showing unsupervised hierarchical clustering of differentially expressed miRNAs in serum EVs of patients before (n = 3) vs. after Etanercept treatment. The colour scale indicates relative fold change (red: high; blue: low).
