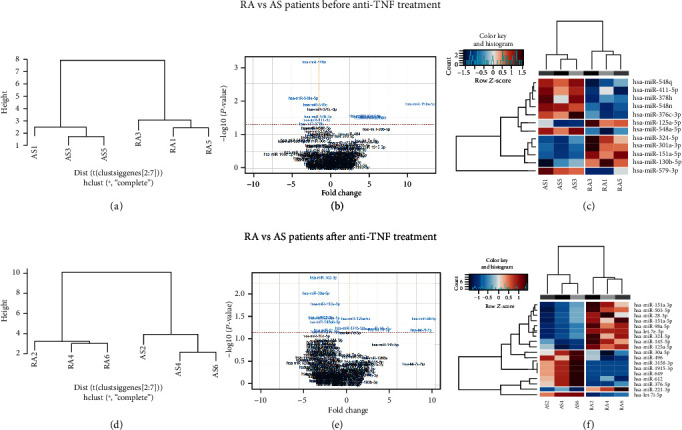
Figure 2.

Serum EV microRNA expression in RA vs. AS patients before and three months after anti-TNF treatment. (a, d) Unsupervised hierarchical clustering analysis. RA vs. AS patients before biological treatment initialization and after agent administration. (b, e) Volcano plots showing the relationship between fold change and significance for RA vs. AS patients before and after anti-TNF therapy. The horizontal dashed line indicates cutoff for significance p < 0.05 (−log10 p value > 1.3) and the vertical lines for fold change ≥ 1.5/≤−1.5. Significantly different miRNAs are highlighted in blue. (c) Heatmaps showing unsupervised hierarchical clustering of differentially expressed miRNAs in serum EVs of RA vs. AS patients before (n = 3) and after treatment. The colour scale indicates relative fold change (red: high; blue: low).
