
Figure 2.
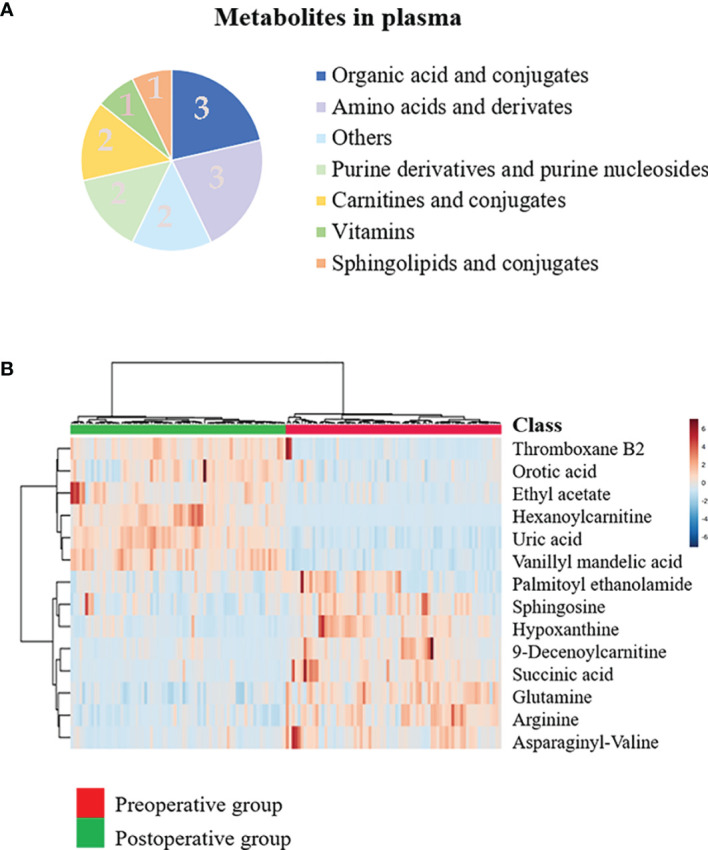
Discovery of the prognostic biomarkers for oral squamous cell carcinoma (OSCC) in plasma metabolomics. (A) Pie chart summarizing the taxonomic annotation of differentially expressed metabolites in the preoperative group vs. postoperative group (numbers in the pie chart represent the number of metabolites). (B) Heatmap representing the relative levels of 14 significantly different metabolites in the plasma samples of the preoperative group and postoperative group.