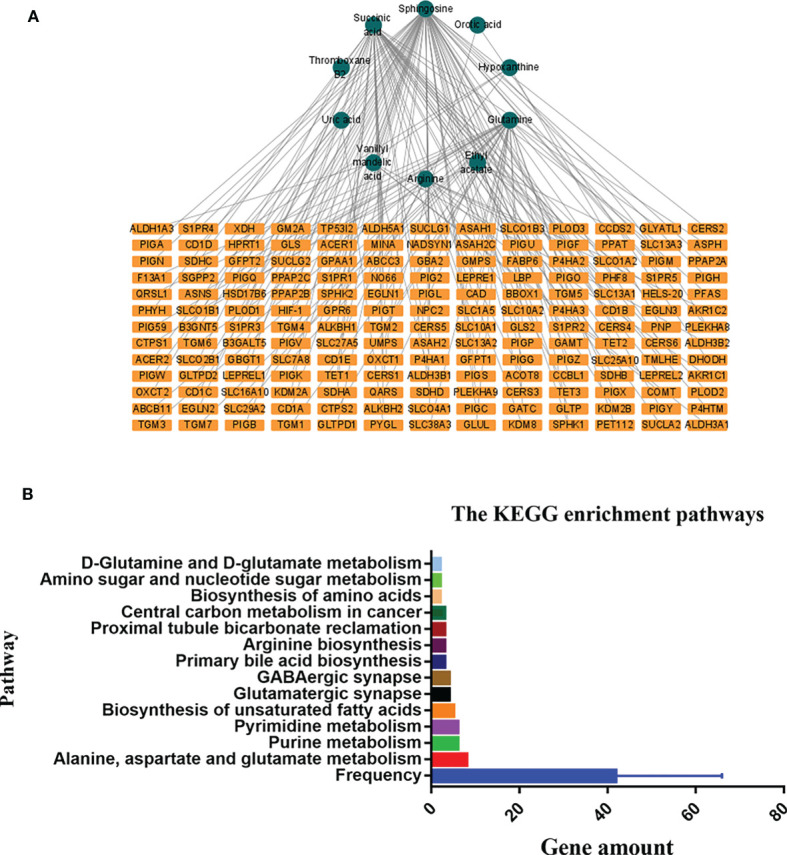
Figure 7.

The connected network of metabolites and genes in graph (A). The orange rectangles circles node represents the differentially expressed metabolites in the preoperative group vs. postoperative group. The blue rectangles represent the genes closely correlated with those metabolites. The Kyoto Encyclopedia of Genes and Genomes (KEGG) enrichment pathways in the preoperative group and postoperative group in graph (B).
