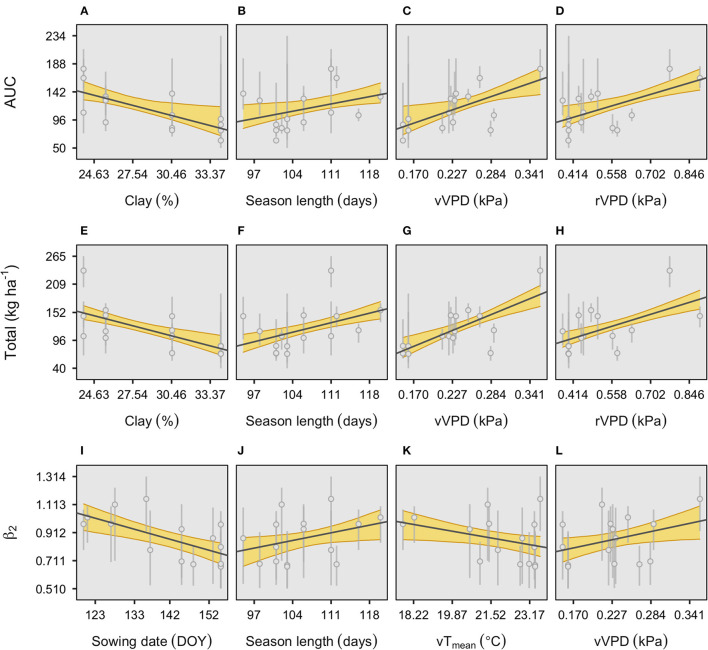
Figure 3.
Individual plots of the four environmental effects affecting the main parameters of the fixed-N response to relative phenology, descriptors of the area under the curve (A–D), total fixed-N at maturity (E–H), and time to maximum growth (ß2) (I–L). The shaded area represents 95% credible intervals. Error bars represent the 95% credible interval of each parameter estimate. Further details on these variables and their units are presented in Table 2. r, reproductive period (R1–R7); v, vegetative period (VE-R1, excluding flowering); VPD, vapor-pressure deficit, and Tmean, mean temperature.

