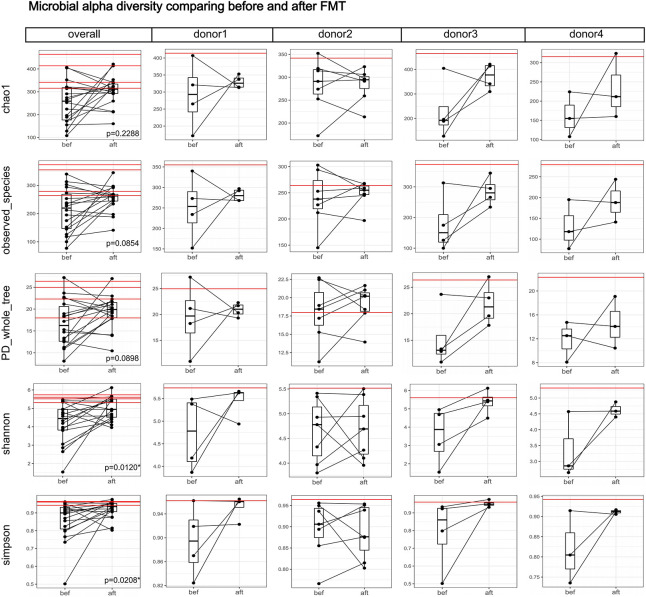
FIGURE 1.
Boxplots comparing the gut microbial alpha diversities before and after FMT. Each black dot represents one sample (patient); pre-FMT and post-FMT samples from the same patient are connected by a black line. Each red horizontal line represents one donor. The “overall” column shows the alpha diversity indexes of the 18 patients and four donors, and the significance test between the before and after groups was a paired-samples Wilcoxon-test (“*” indicates 0.01 ≤ p < 0.05). The Shannon and Simpson indexes increased significantly after FMT. Columns for each donor show the alpha diversity changes in each donor-recipient pair. We did not perform separate significance tests on each donor-recipient pair because of the small sample size.

