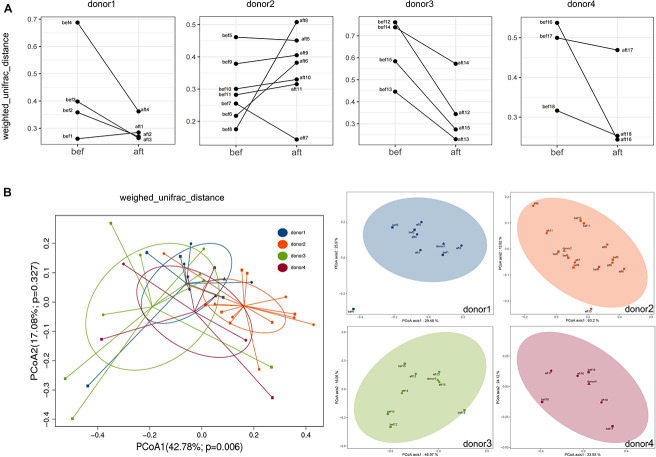
FIGURE 6.
Weighed UniFrac distances of each donor-recipient pair before and after FMT. (A) Each graph shows the changes in distance between recipients and their donor. Fecal microbial profiles of most recipients of Donor 1 and all recipients of Donors 3 and 4 became more similar to those of their donor, while most recipients of Donor 2 showed minimal change or became less similar to those of their donor. (B) PCoA of the microbiota compositions based on UniFrac distances showed the overall beta diversities of the 4 donors and the pre- and post-FMT samples of the 18 patients (left) and of each donor-recipient group (right).

